Chapter 2 Analysing TARA Oceans carbon export data using Tercen
This document describes a walkthrough example of data analysis and visualisation using Tercen. We will analyse data from the TARA Oceans project, coming from this publication: Guidi et al. (2016):
Guidi, L., Chaffron, S., Bittner, L., Eveillard, D., Larhlimi, A., Roux, S., … & Coelho, L. P. (2016). Plankton networks driving carbon export in the oligotrophic ocean. Nature, 532(7600), 465-470.
Our goal is to look at how eukaryotic plankton lineages are associated to environmental parameters such as carbon export. To do so, we will:
create a new project in Tercen
upload the dataset containing the correlation of different lineages to environmental parameters
create a heatmap representing this correlation
Creating a Tercen project
First, we will create a Tercen project for our analyses.
Start Tercen and log in
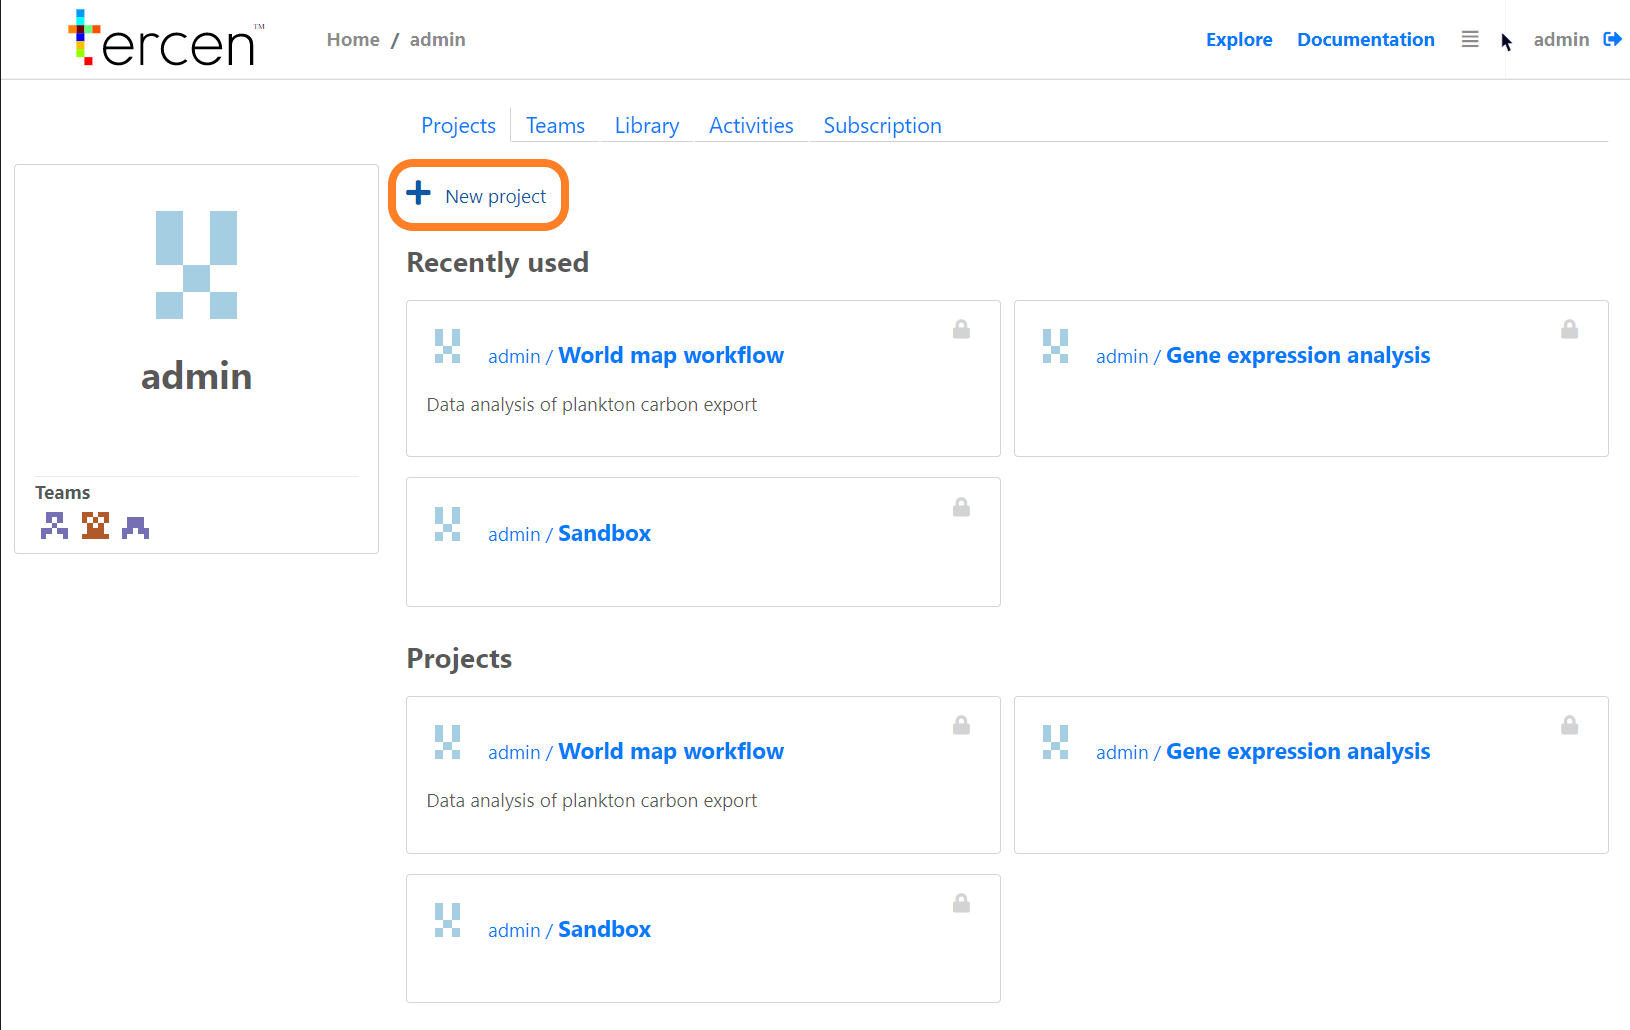
Click on New project
Assign the team of your choice to the project
Give a name and description to this project, then click on OK
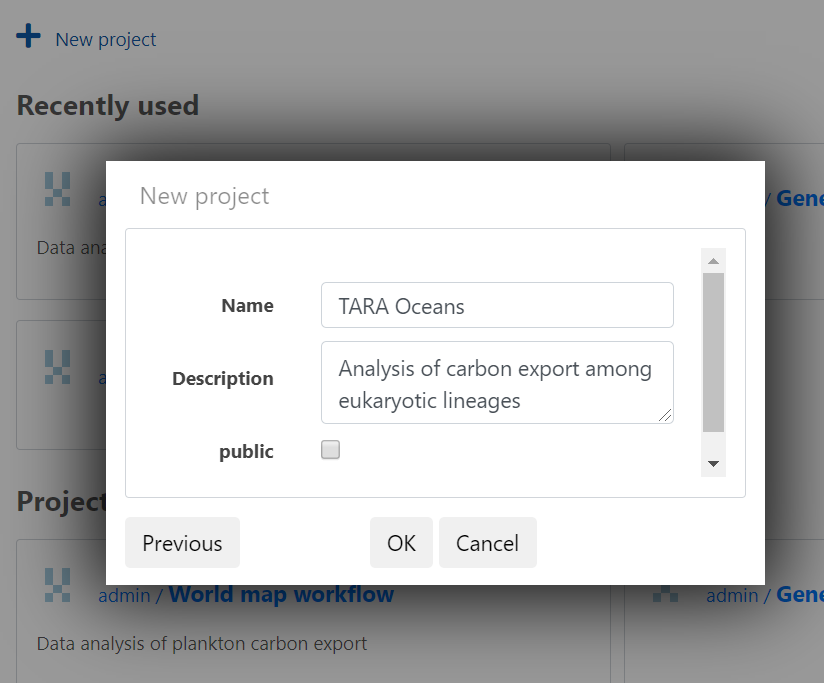
- Your project is now created !
Loading data into Tercen
We will use data from Guidi et al. (2016), more specifically the Supplementary Table 5.
1. Download the data onto your computer
You can find the data here: https://github.com/tercen/tara_guidi2016_data. In this tutorial, we will just use the SI5_eukaryotic_lineages.tsv file.
2. Go back to Tercen and load the data
Now that we have the data on our computer, we can import it into Tercen.
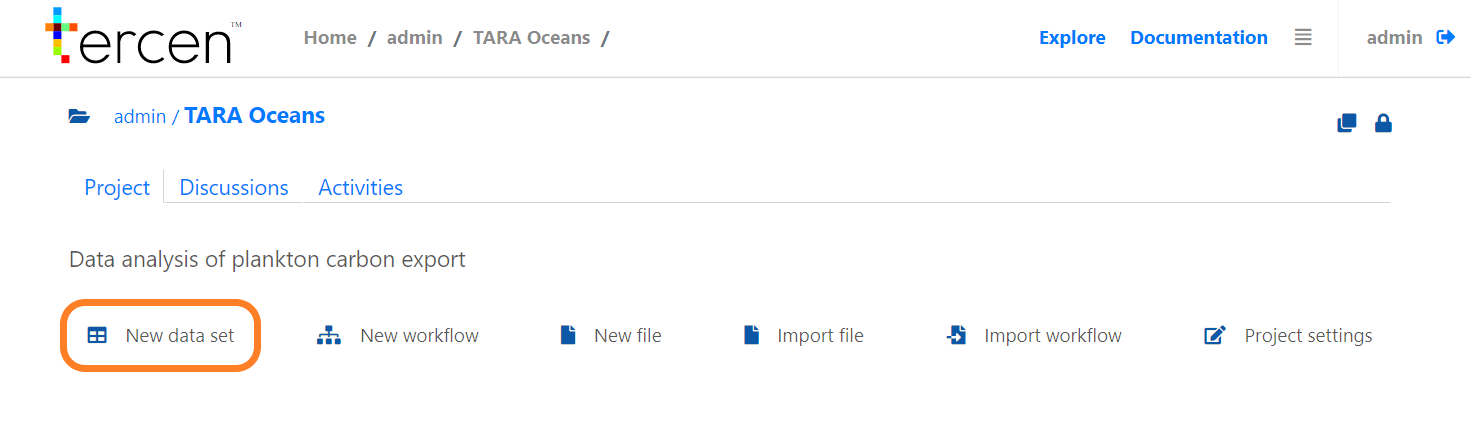
Go to the newly created project
Click on New data set
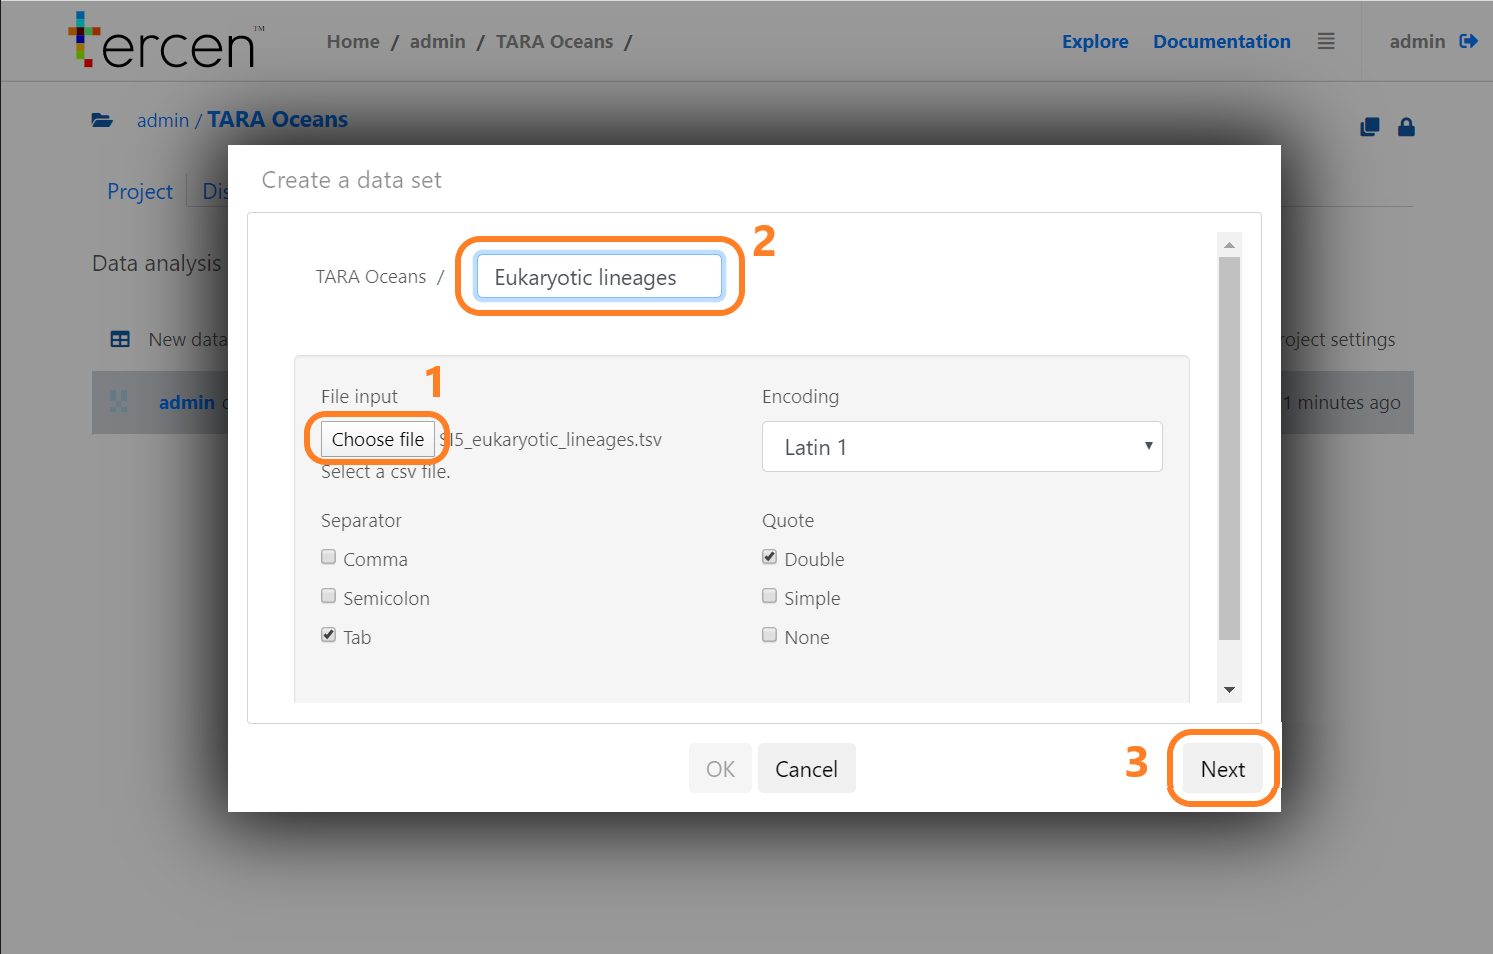
Upload the
SI5_eukaryotic_lineages.tsvfile (1)Give a name to the data set (2)
Click on Next (3)
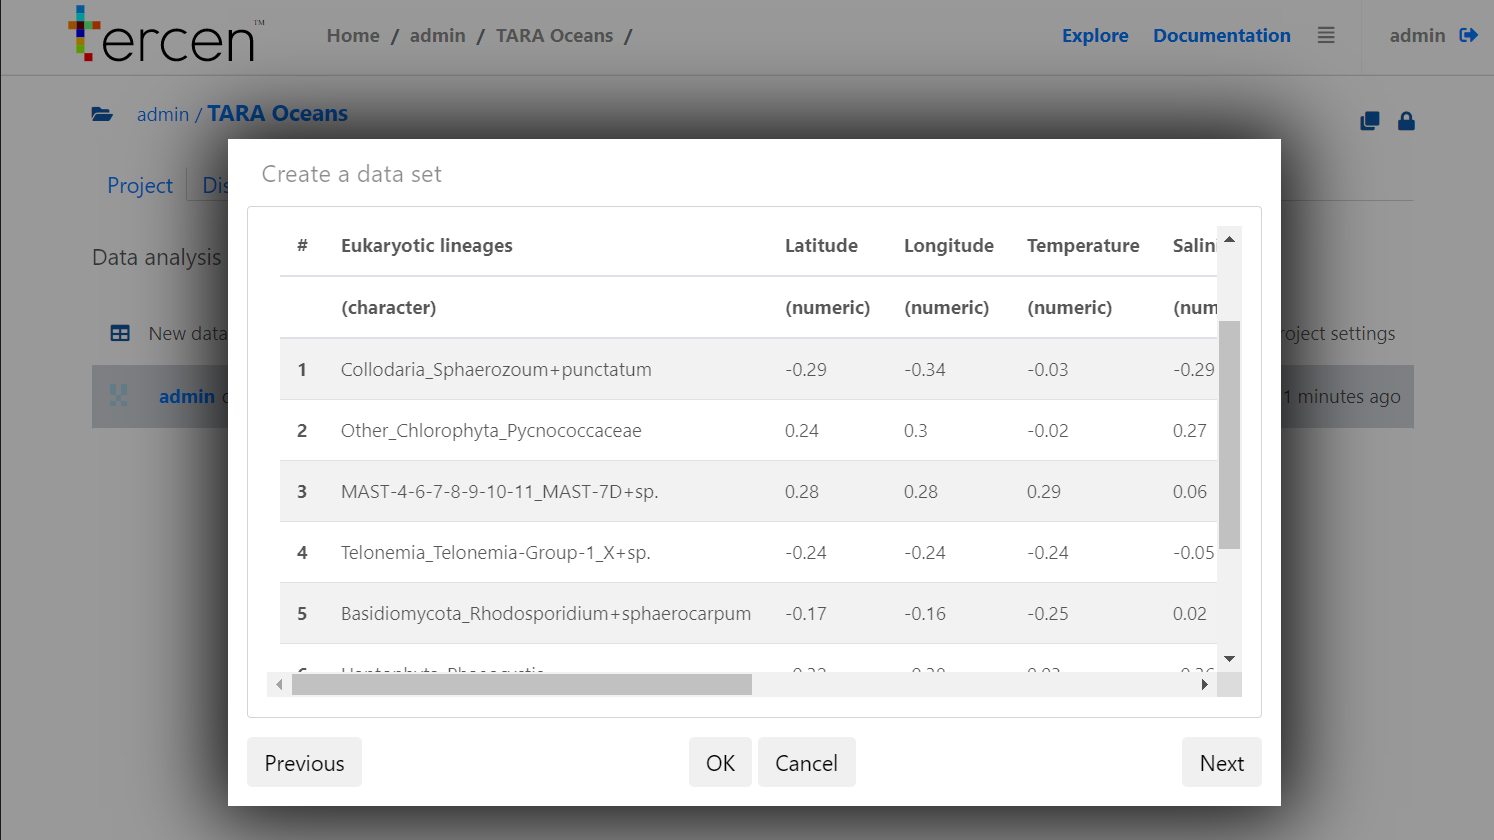
- Check that the data set has been loaded properly and click on Next
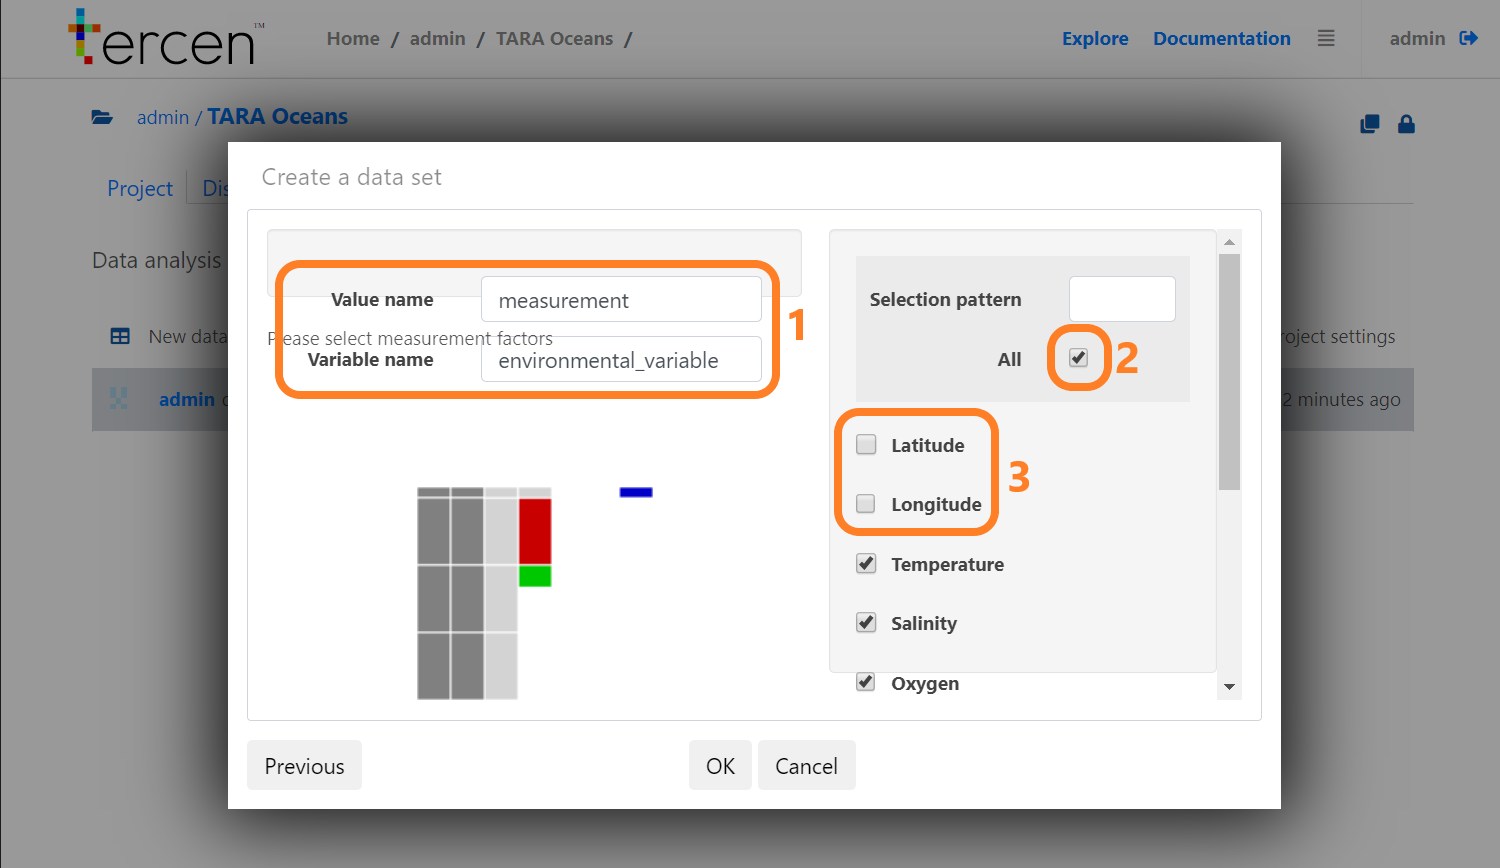
Give a name to the values (here,
measurement) and variables (here,environmental_variable) (1)Check all the variables (2)
Uncheck the ones that are not part of the environmental parameters of interest (here, Latitude and Longitude) (3) and click on OK
- The data set is now uploaded to Tercen!
Creating a workflow
Now that we have created our dataset, we will create a workflow to analyse and visualise it.
Click on New workflow
Give a name to your workflow
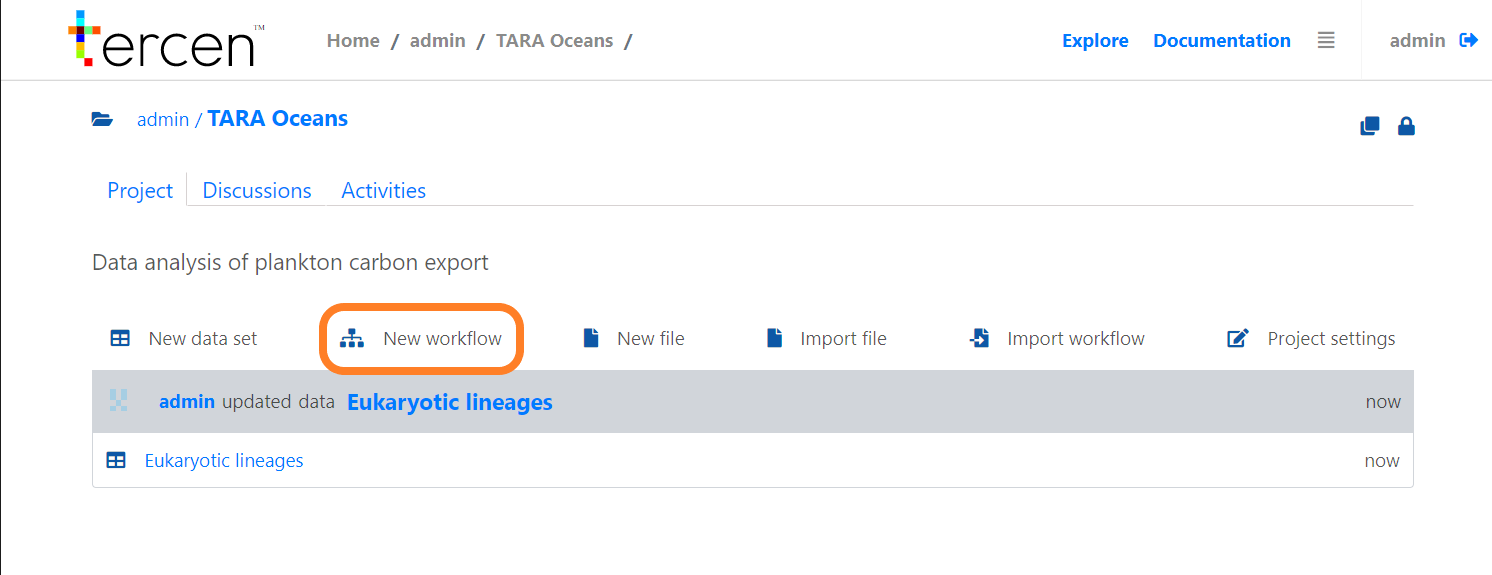
Your workflow appears now in your project. Click on it
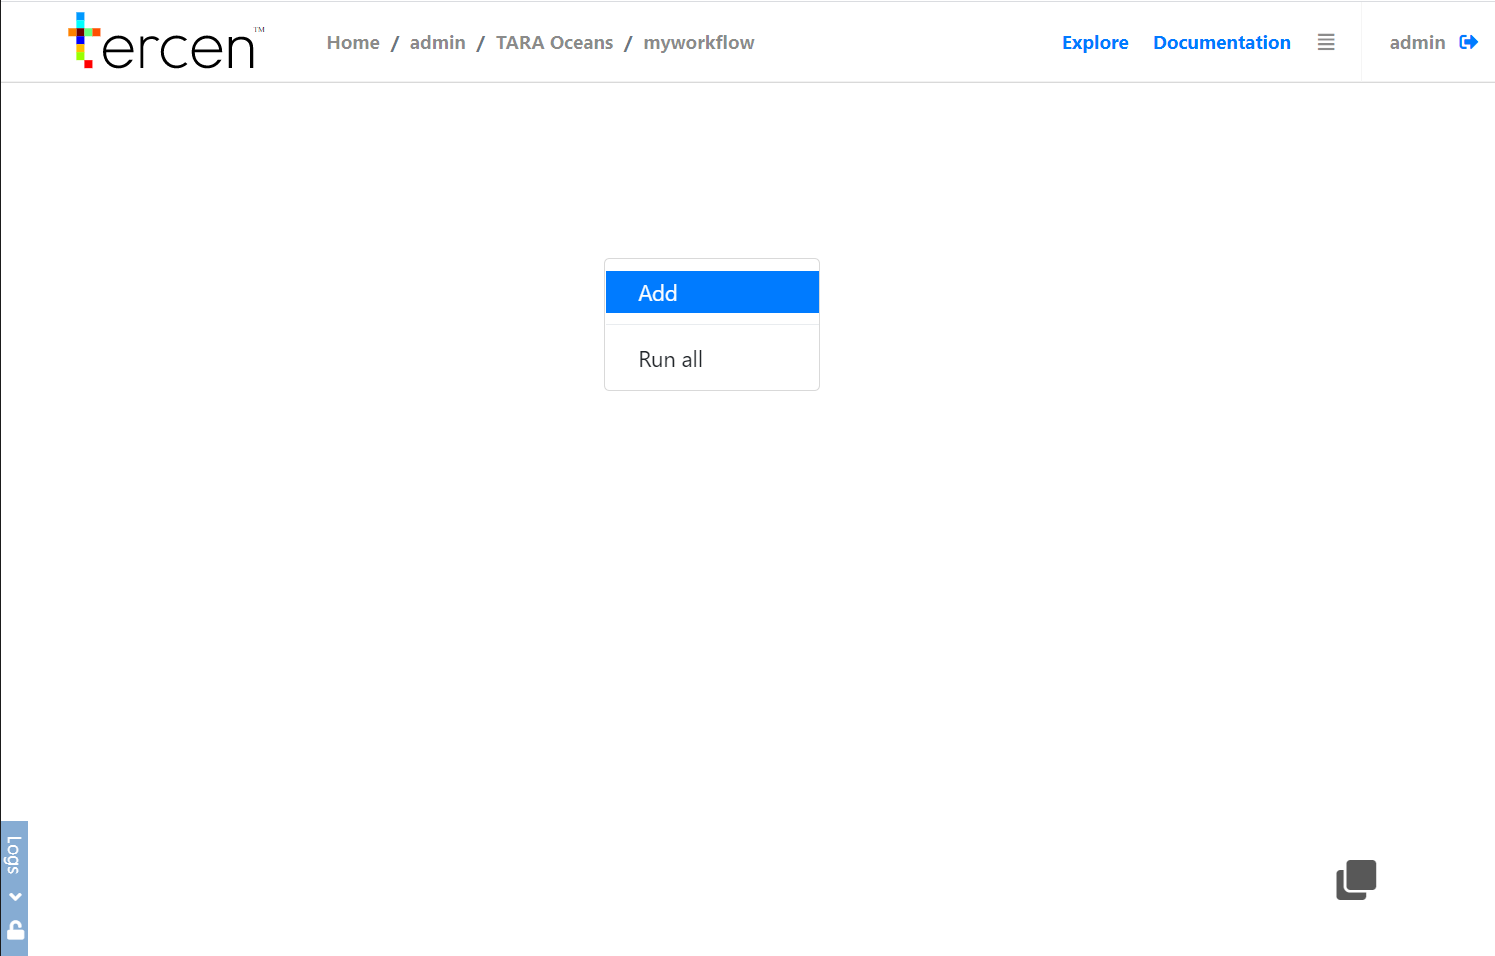
Your are now on the workflow environment that is empty. We will now add the data set we uploaded before. Right click anywhere in the blank area and click on Add.
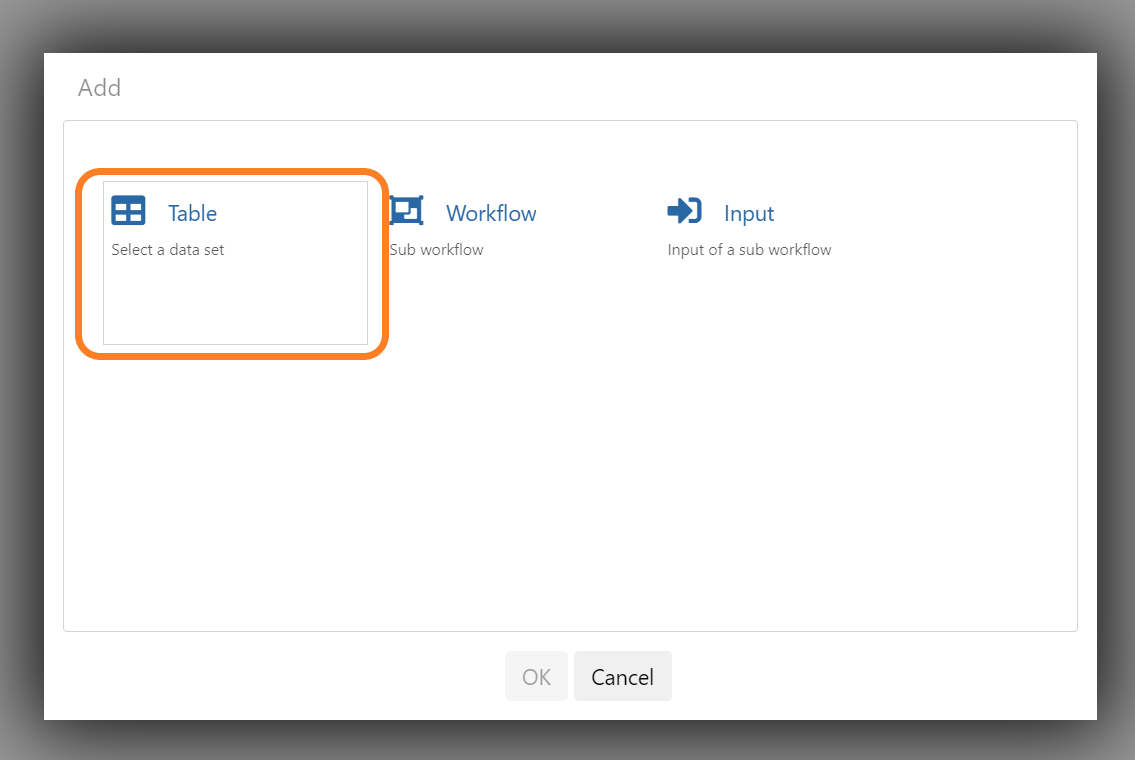
- Select Table and click on OK.
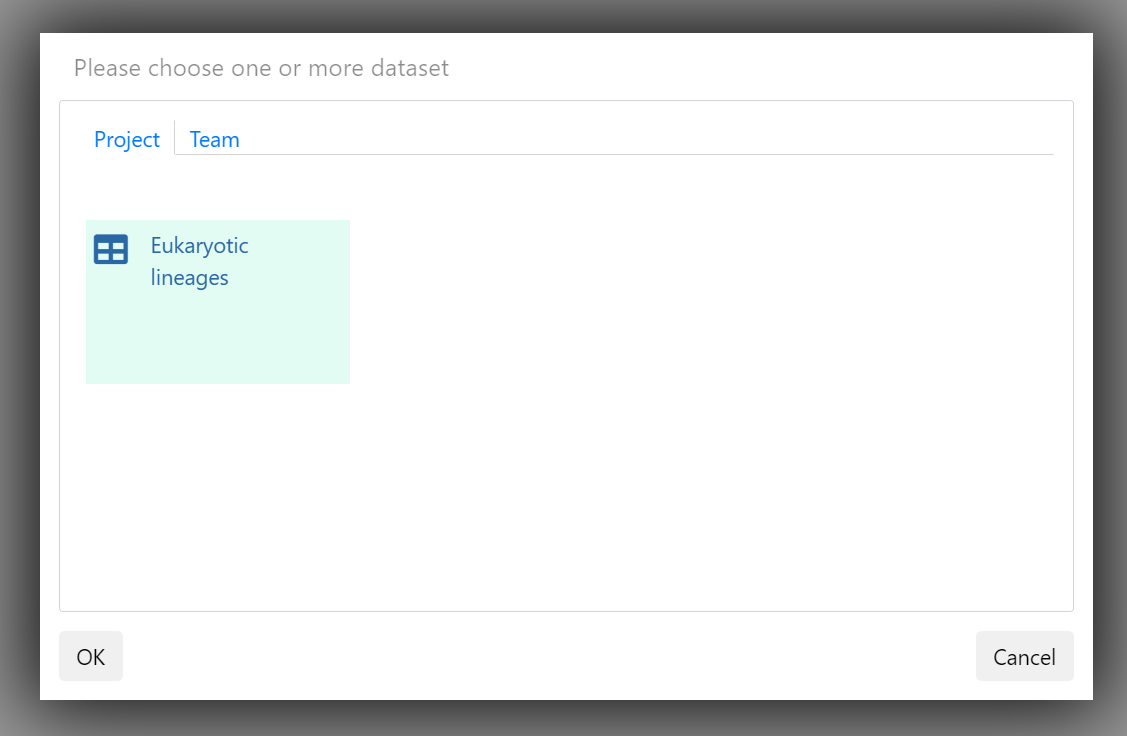
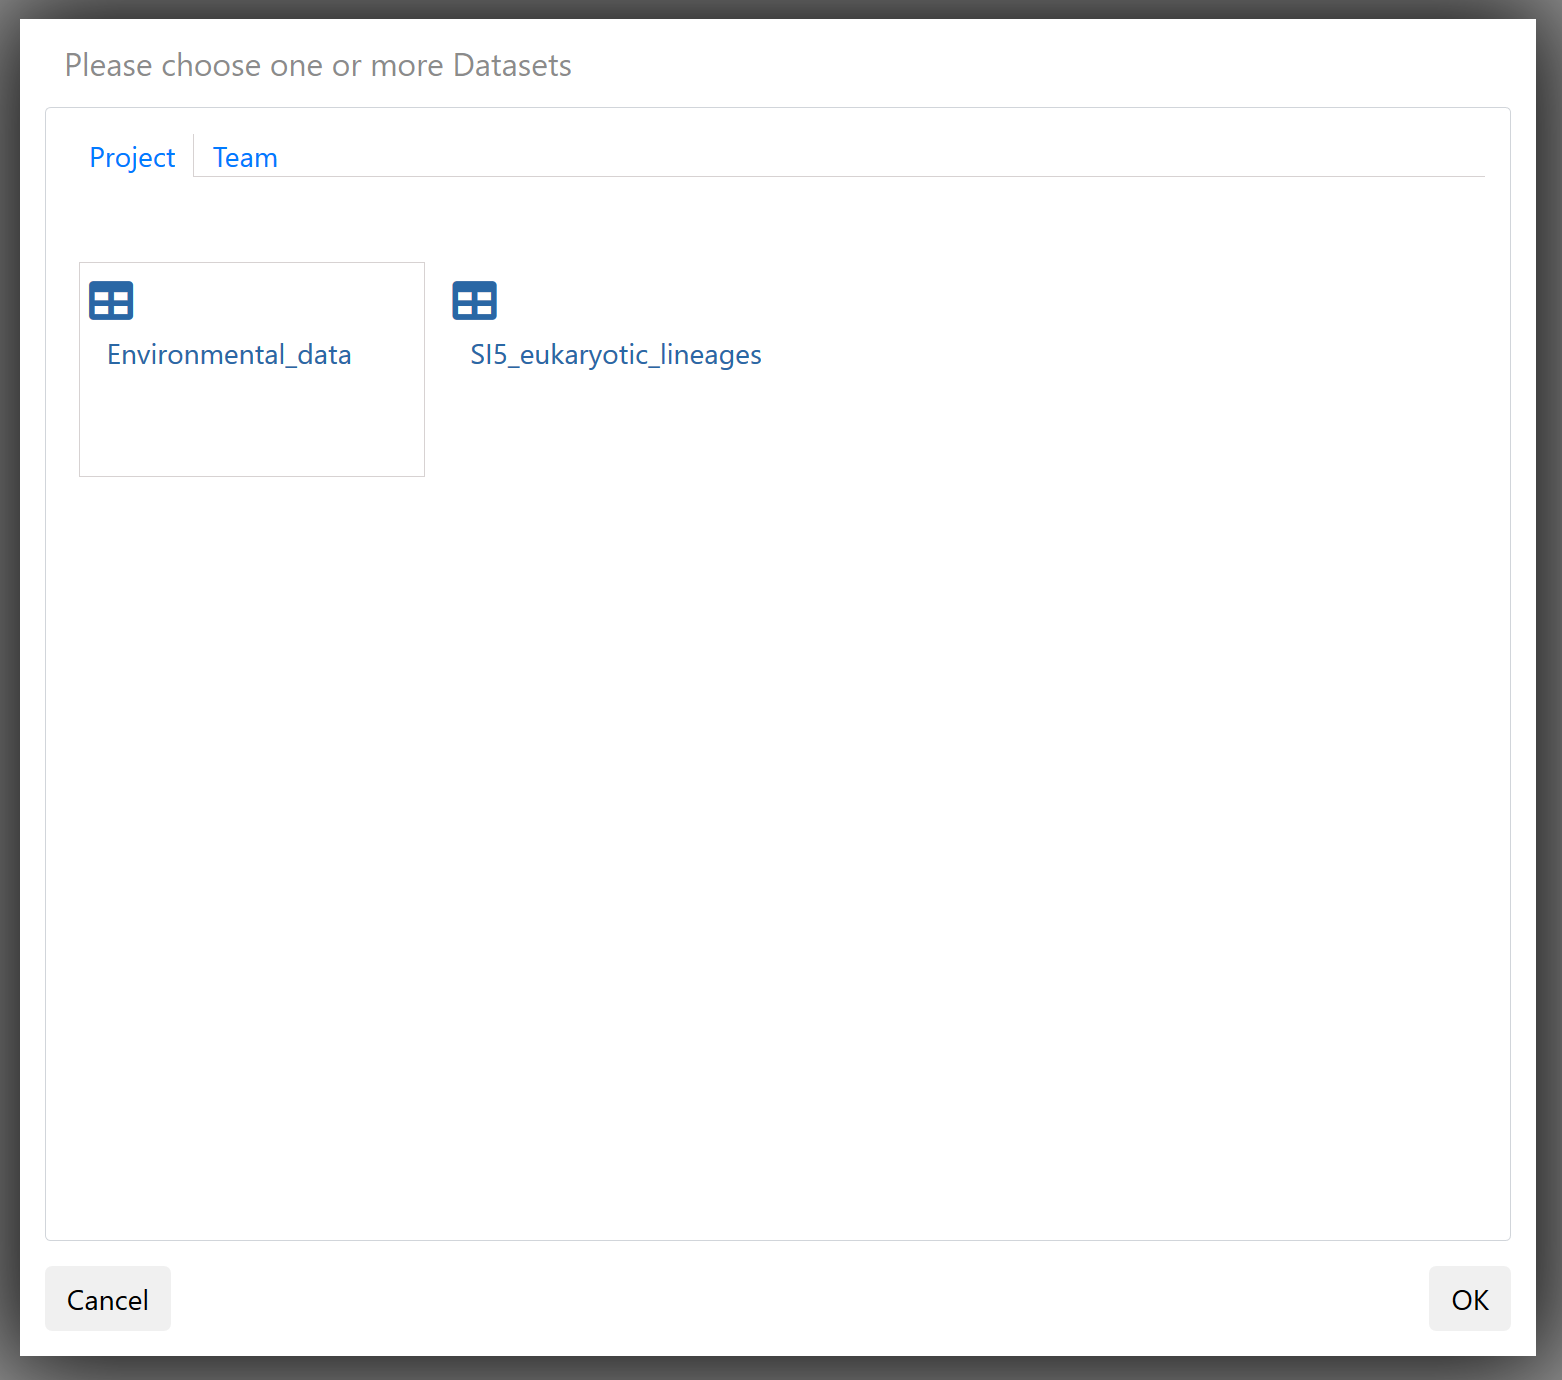
- Select the data set and click on OK.
- Now the data set is ready to be used !
Making a heatmap
To analyse our data we need to:
1. Add a data step to the workflow
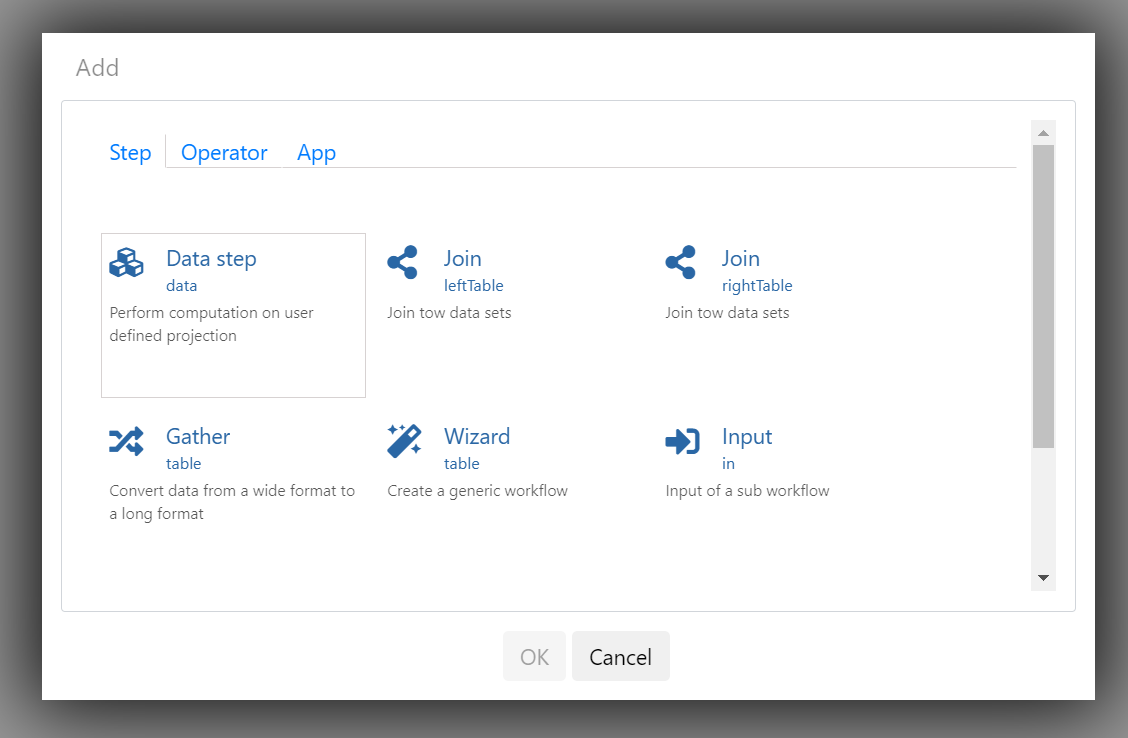
- Right click on the data set and select Add
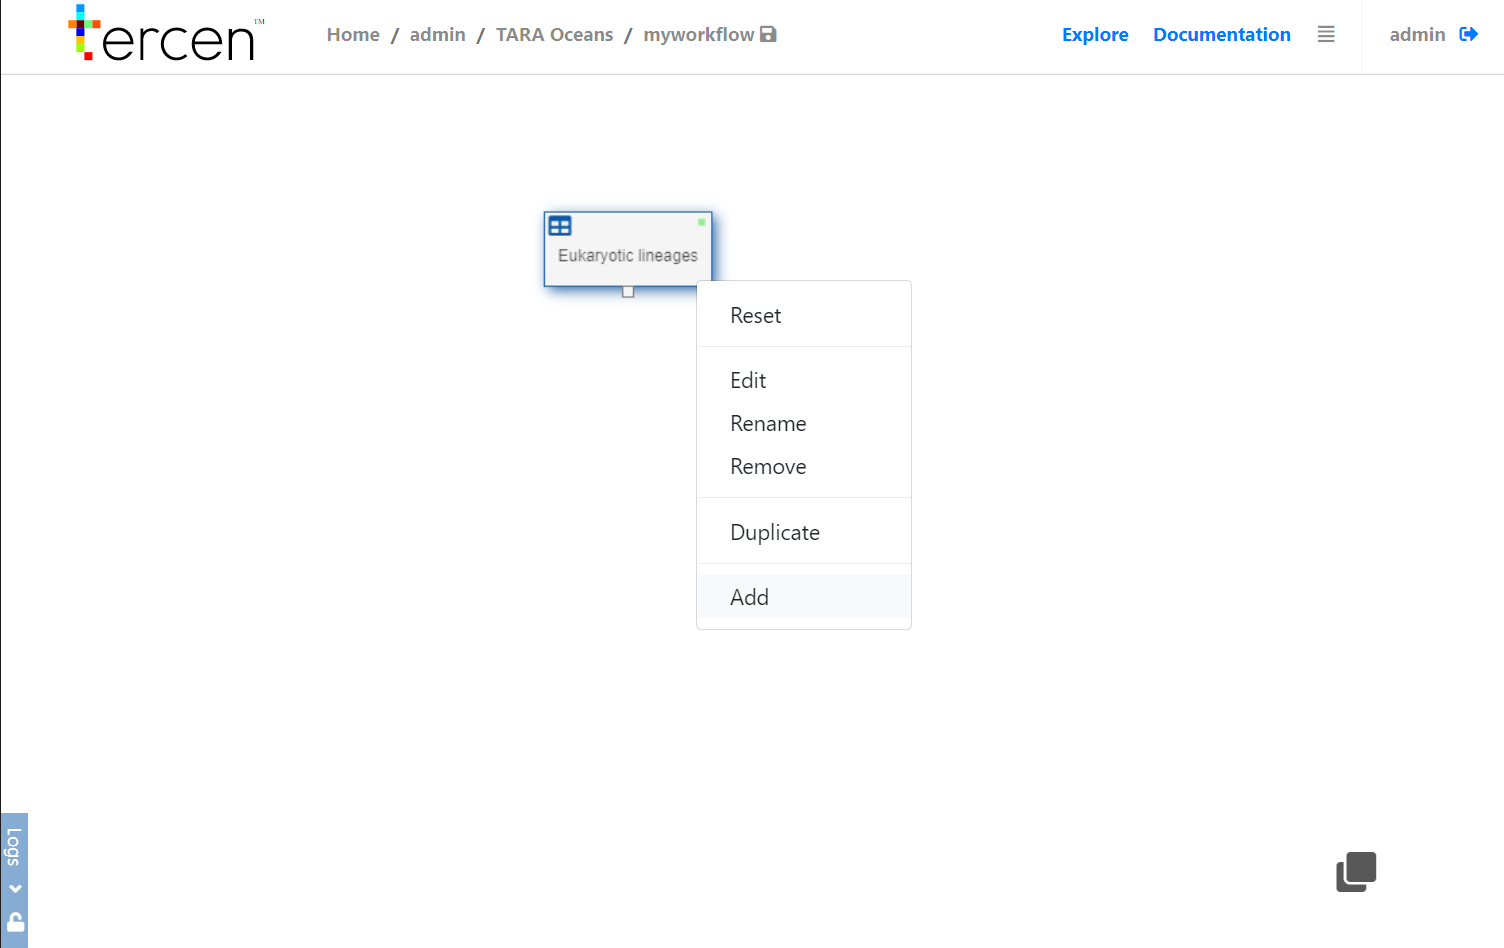
- Select Data step
2. Make the heatmap projection
- Double click on the newly created data step
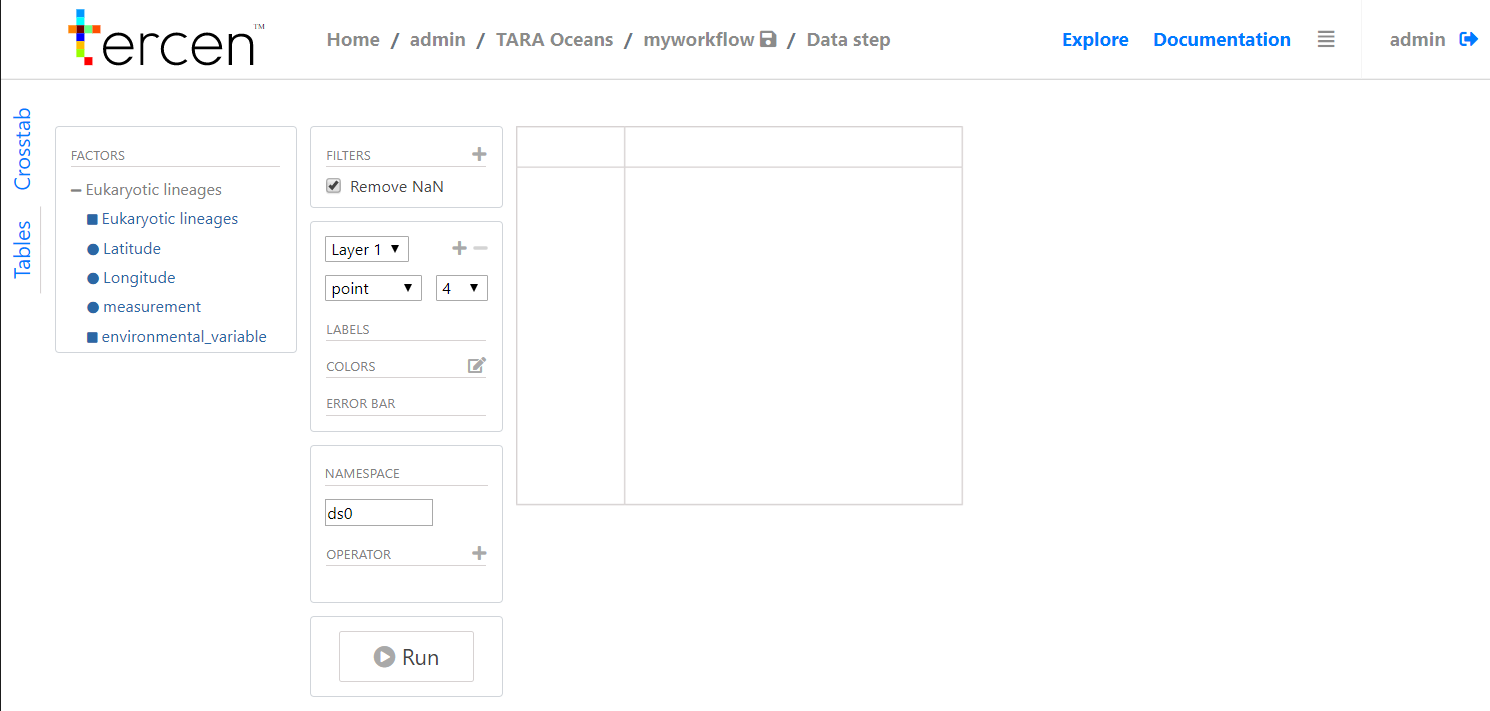
- Drag and drop elements to make the heatmap projection as in the following video:
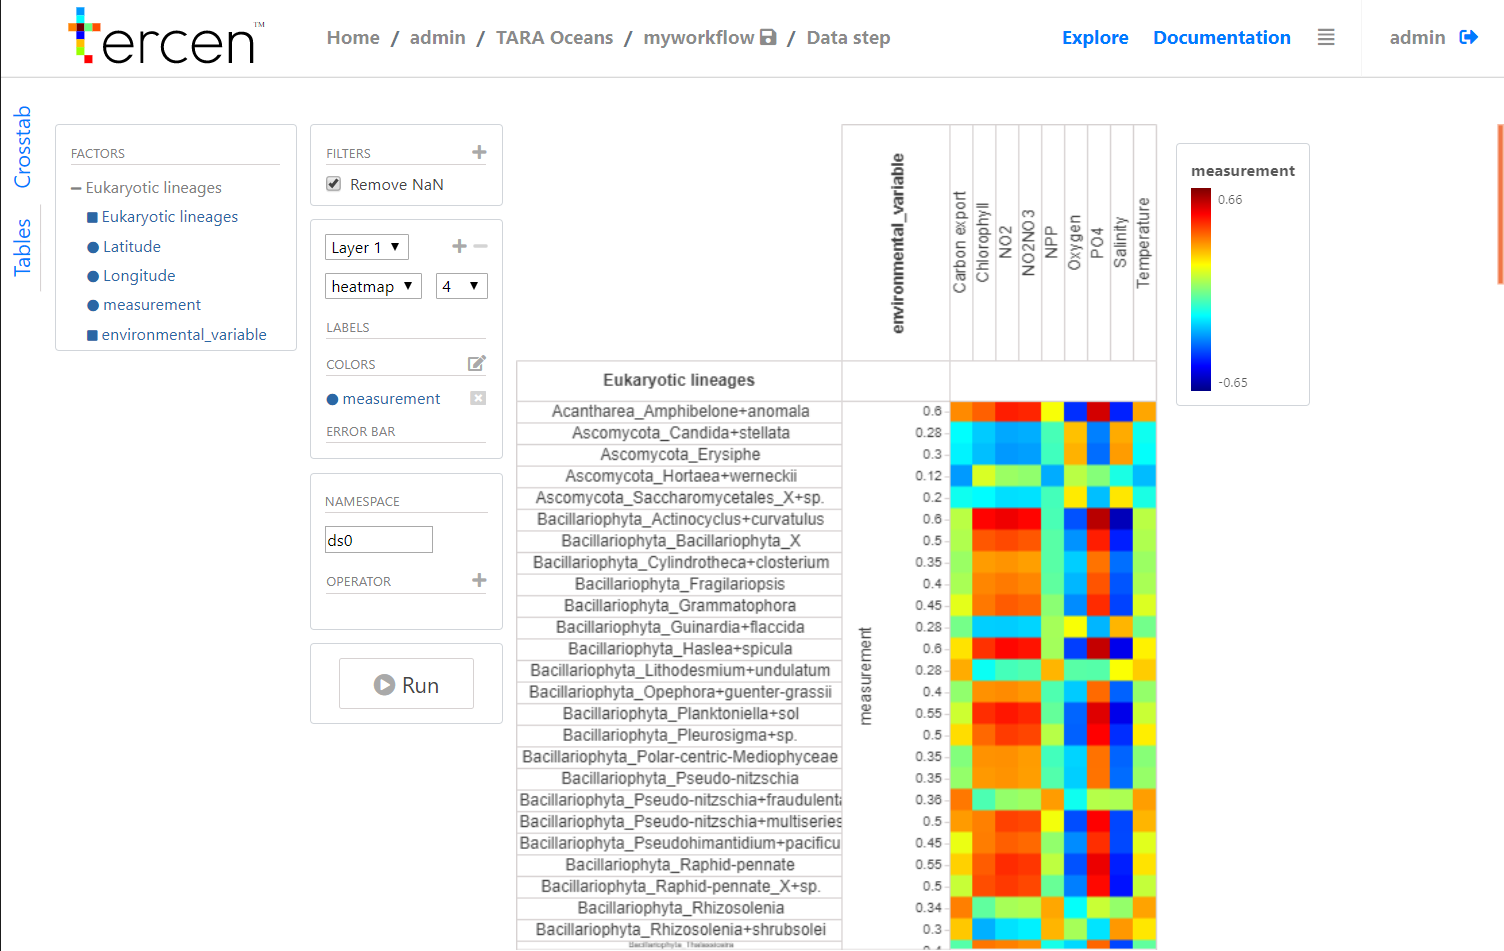
- We now have our first heatmap, our data projection should look like this:
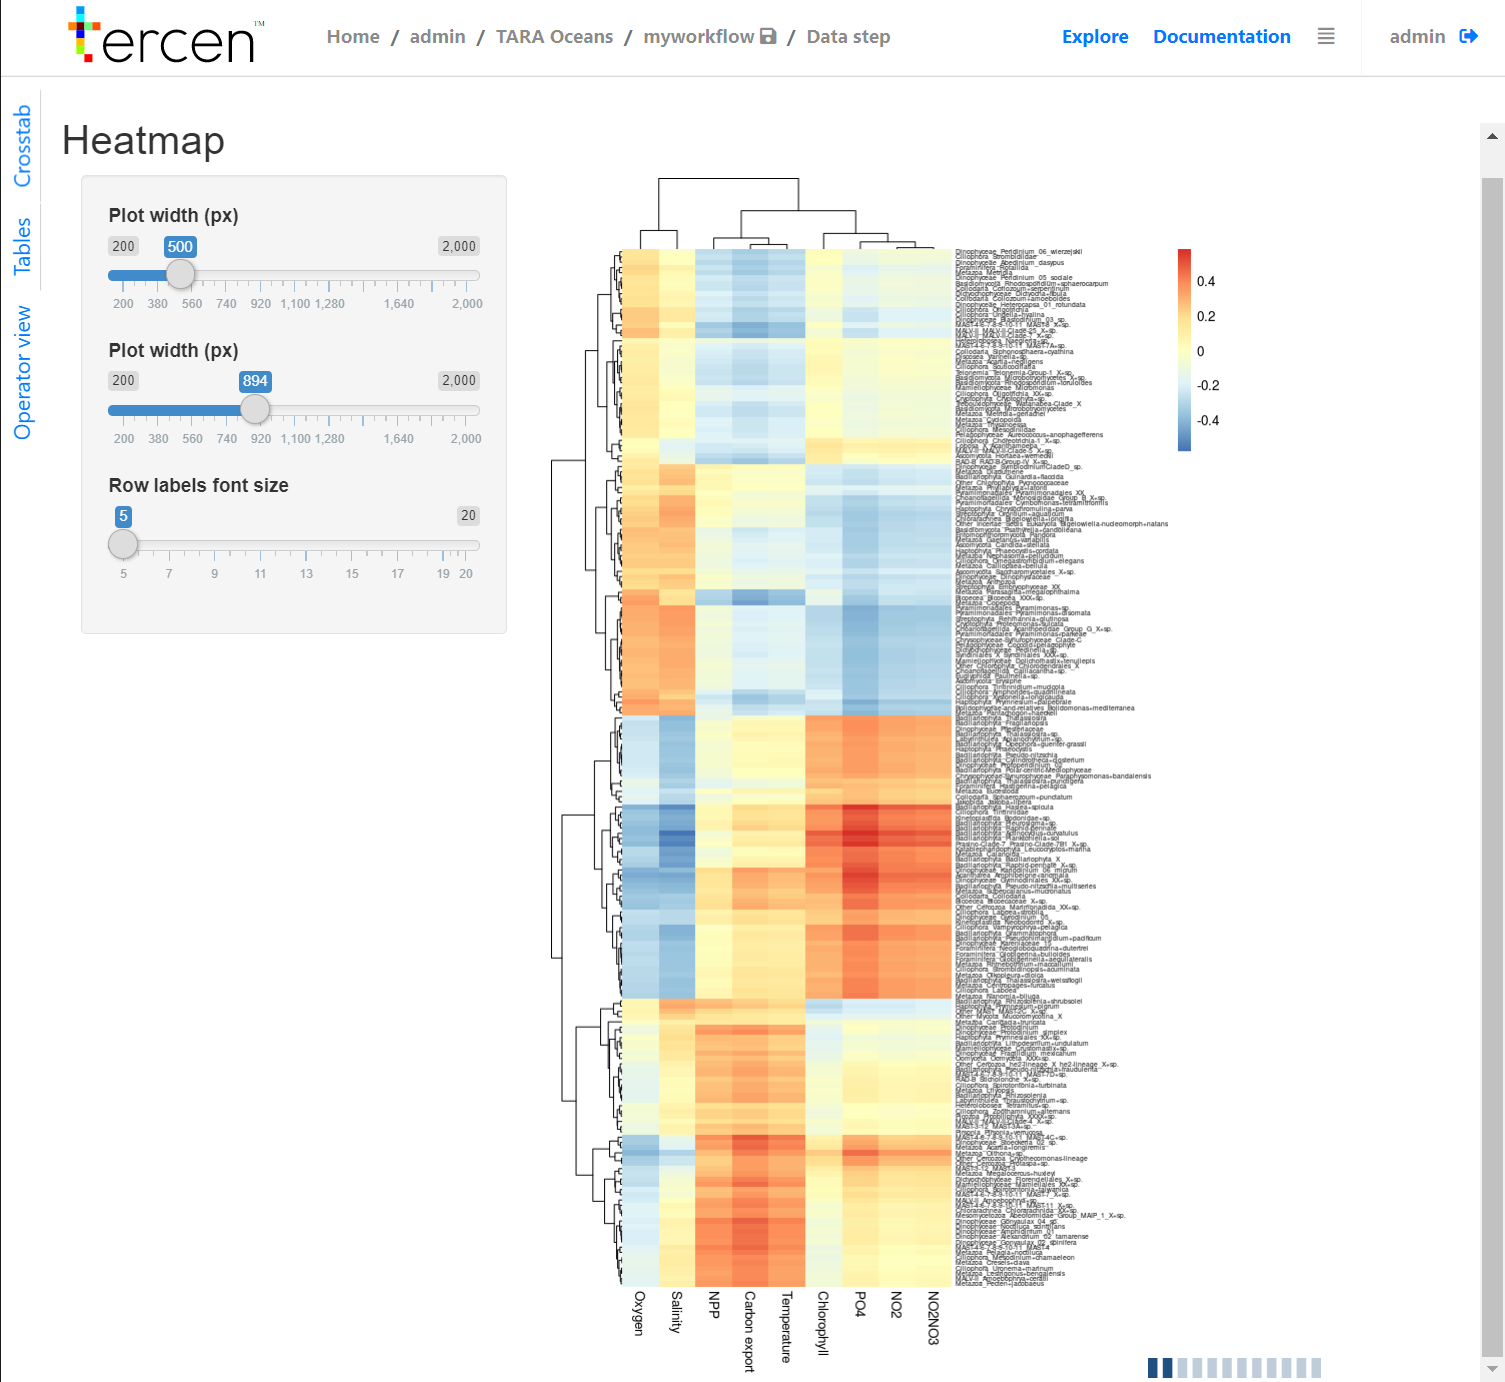
3. Improve the heatmap by ordering rows and columns and adding dendrograms
This heatmap looks nice, but it would be better if we could order rows and columns and add dendrograms! That way we could see which species and environmental parameters cluster together.
Tercen includes a heatmap operator (called Shiny Heatmap) to make such a representation.
In short, operators take as input Tercen projections and return computations and views. In our case, we call it a Shiny operator as it is based on the R/Shiny framework designed to produce interactive visualisations such as this heatmap.
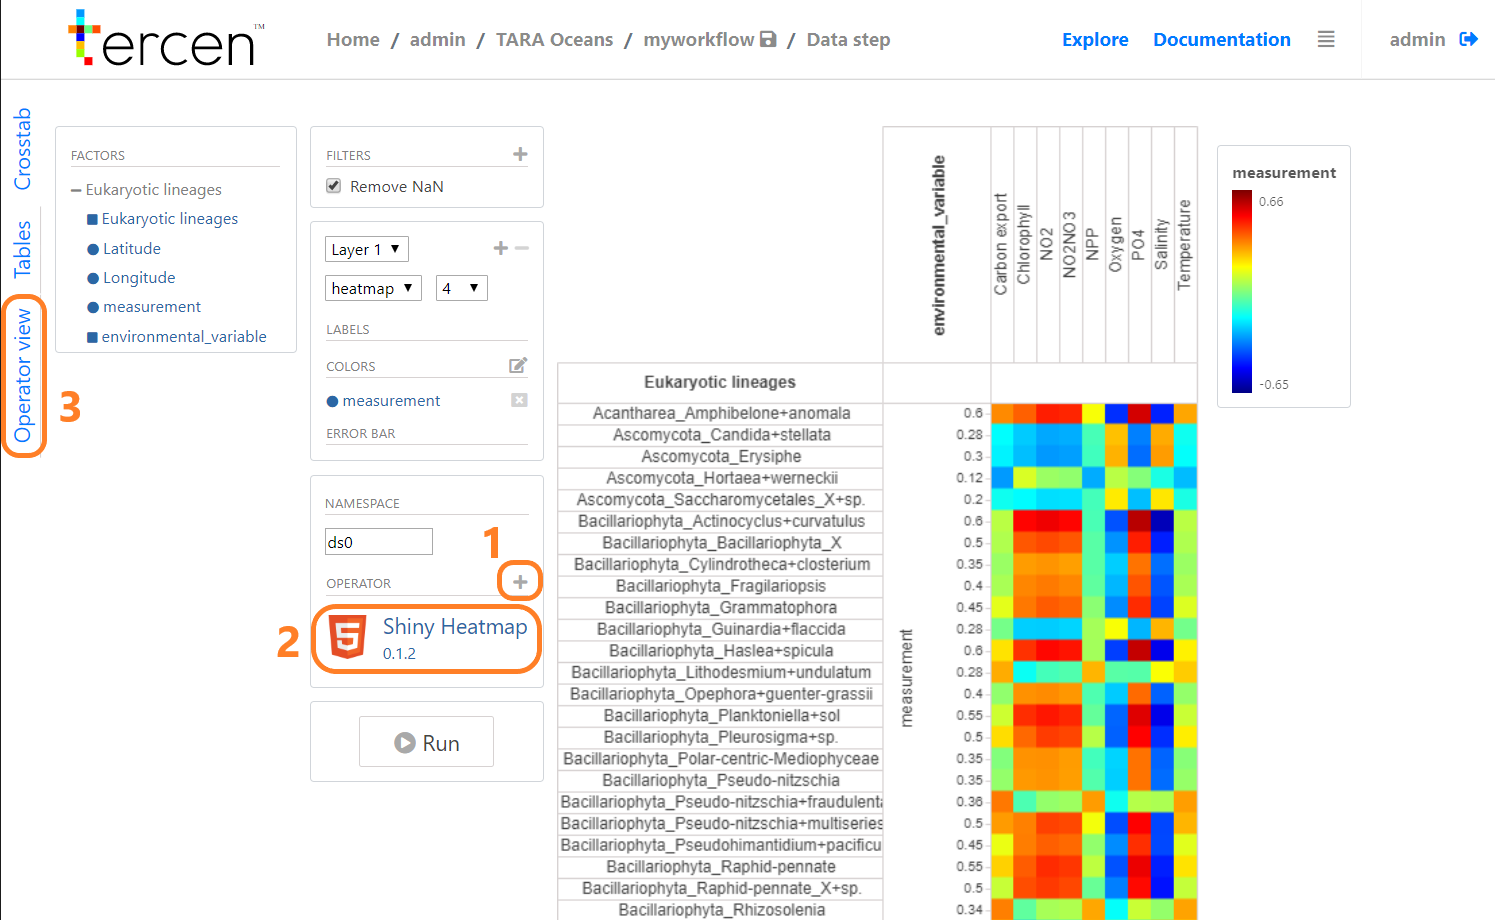
In the sidebar, click on the plus sign to add an operator (1)
Pick the
shiny_heatmap_operator. It appears now the data step environment (2)Then click on Operator view tab on the left to see the result (3)
Et voilà! The operator view appeared, as well as our heatmap with a dendrogram:
Making a world map
1. Add the data and a data step to the workflow
Right click on the blank area and select Add
Add the
Environmental_datadata table to the workflow
Right click on the data set and select Add
Select Data step
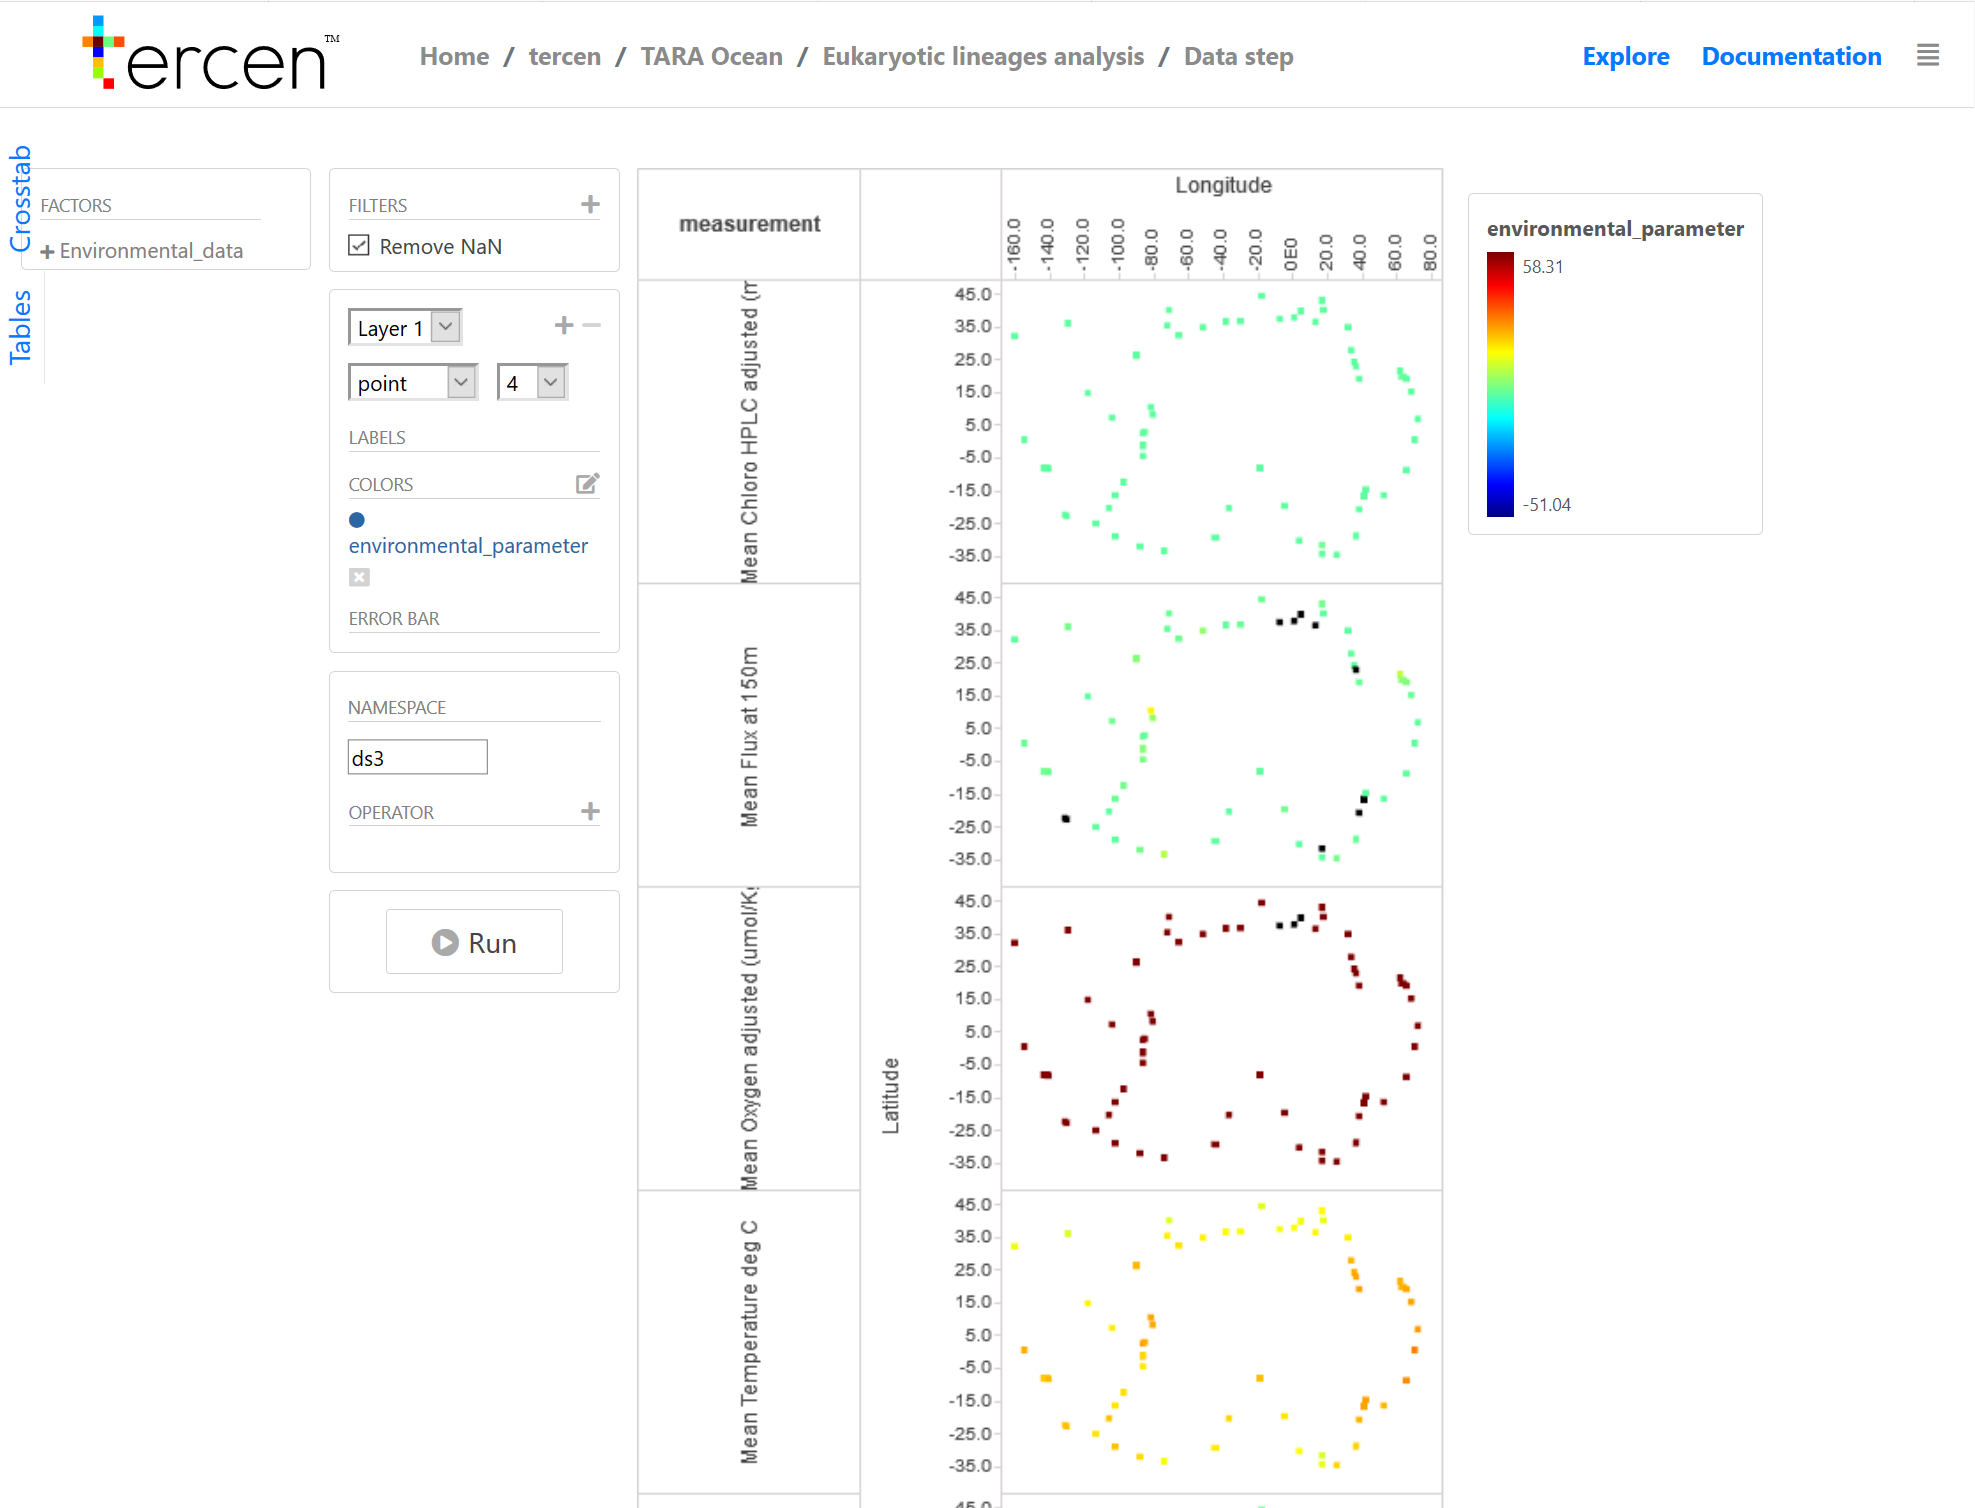
2. Make the map projection
Double click on the newly created data step
Drag and drop elements to make the worldmap projection: . We now have our first heatmap, our data projection should look like this:
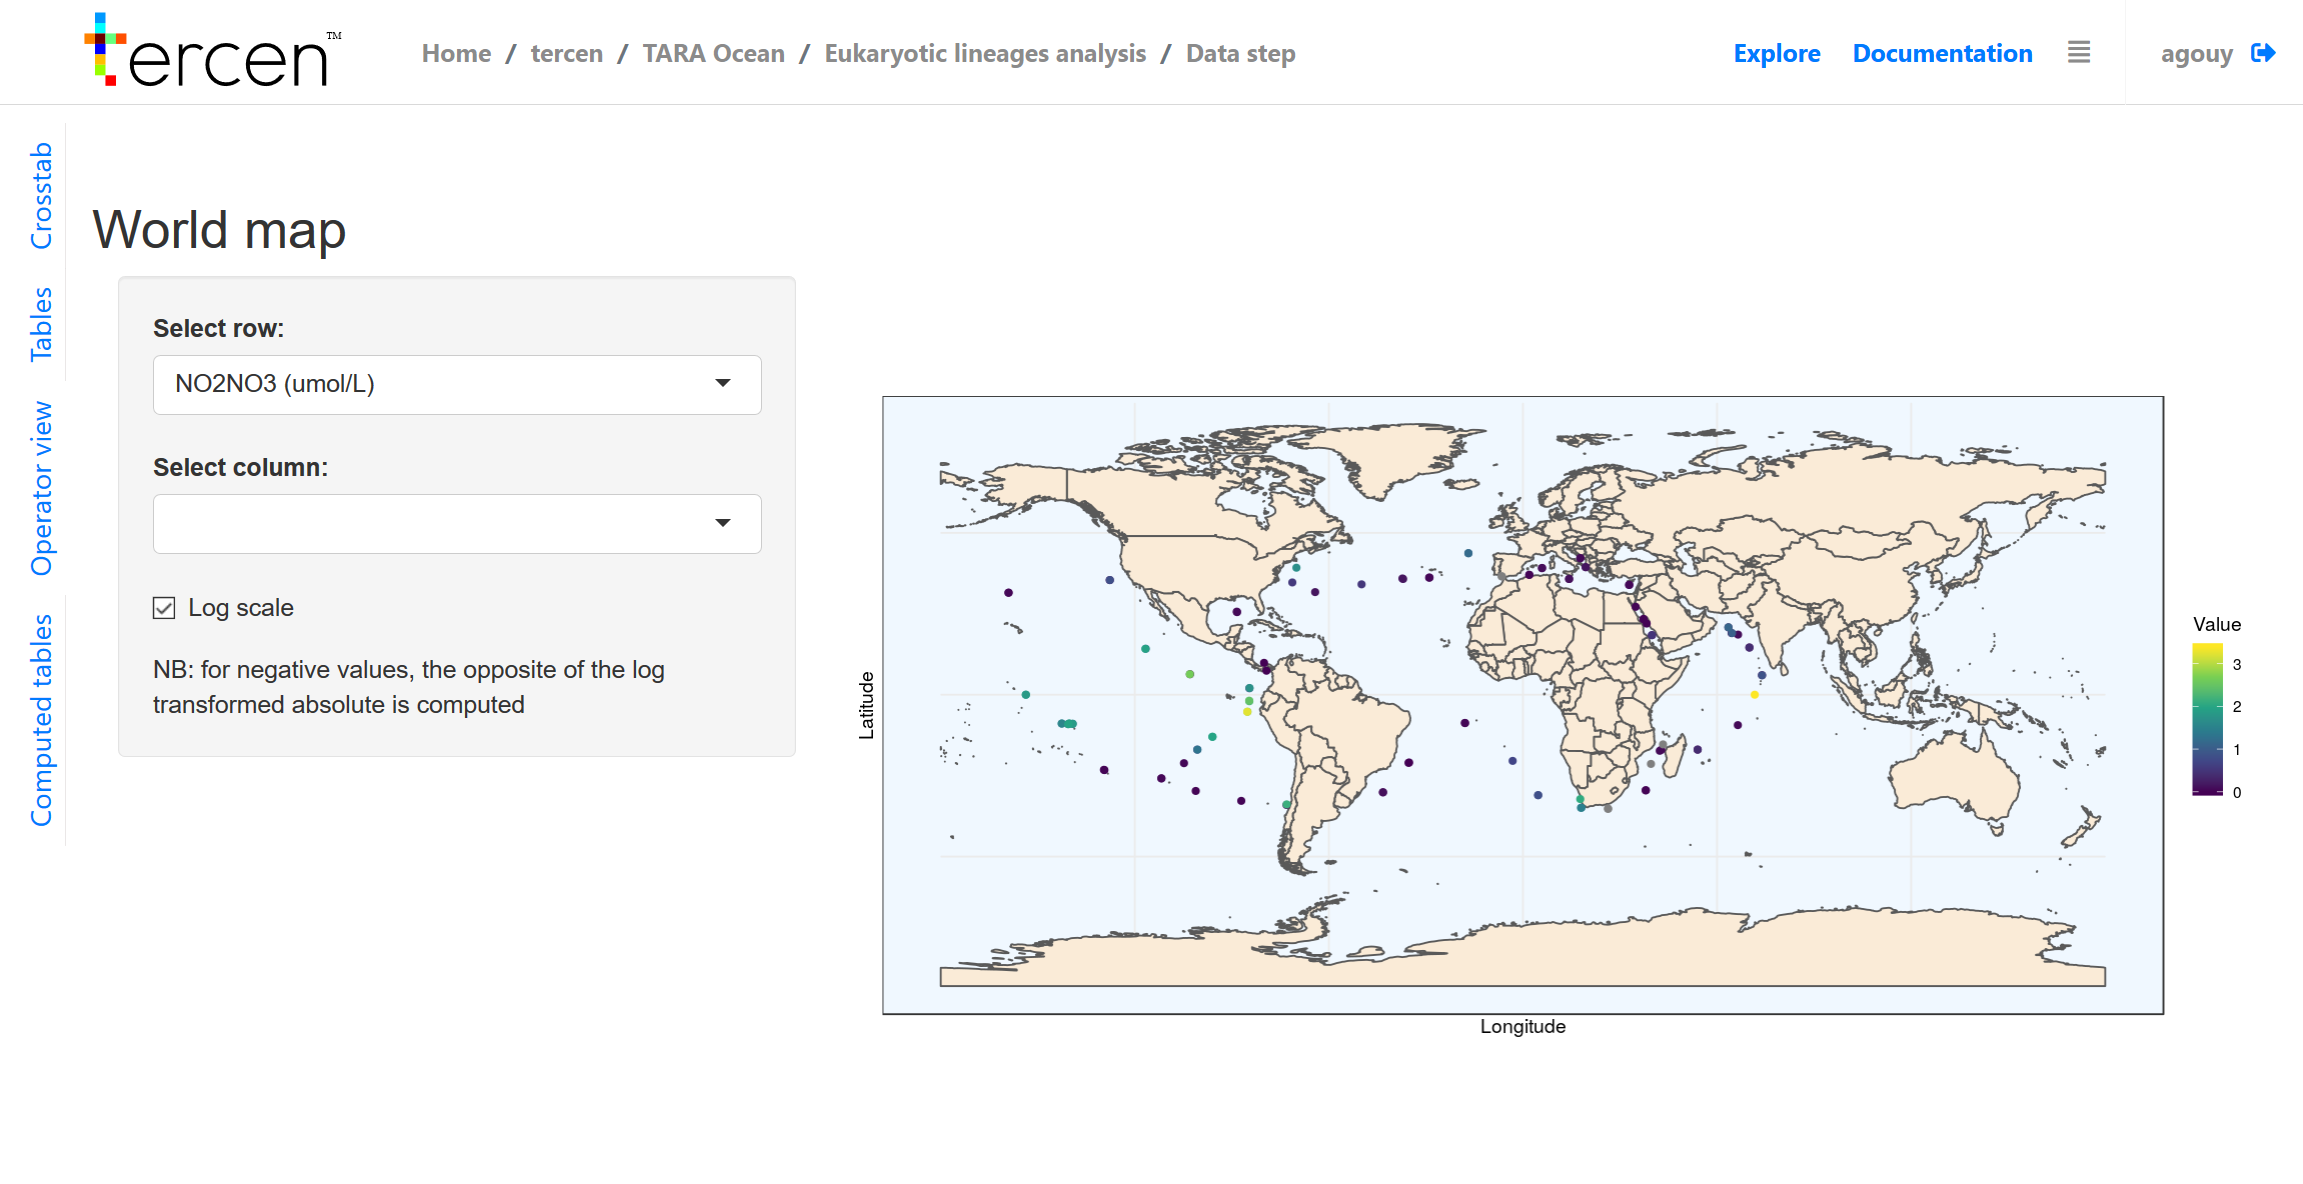
3. Make a better looking worldmap
We can already see the data we want to see, however it would be much better with a base map. Tercen includes a worldmap operator (called Worldmap Shiny) to make such a representation.
In short, operators take as input Tercen projections and return computations and views. In our case, we call it a Shiny operator as it is based on the R/Shiny framework designed to produce interactive visualisations such as this worldmap.
In the sidebar, click on the plus sign to add an operator
Pick the
Worldmapoperator. It appears now the data step environmentThen click on Operator view tab on the left to see the result: