Chapter 11 Define a view
In this section you create a visual using projections in the cross-tab window.
Once you have imported your data into the workflow now you can configure a projection.
Right click on the Table step and select Add
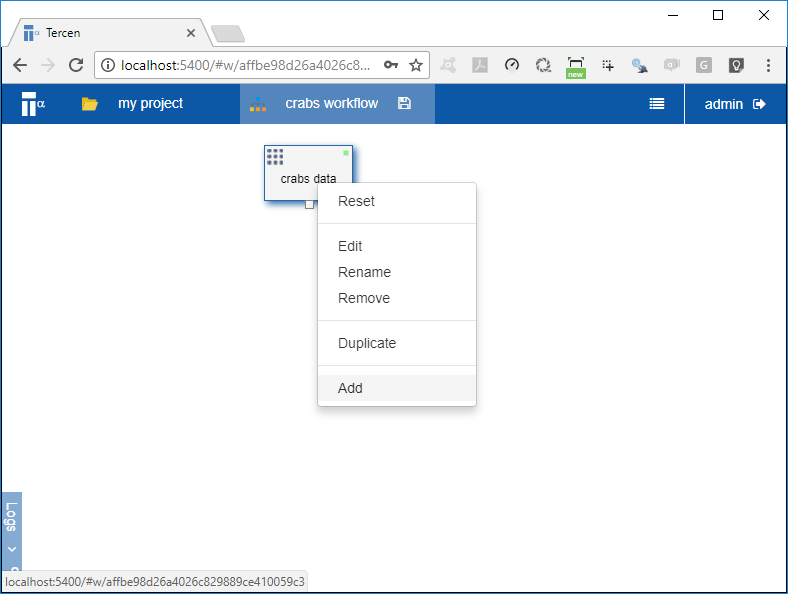
Select Data step and click OK.
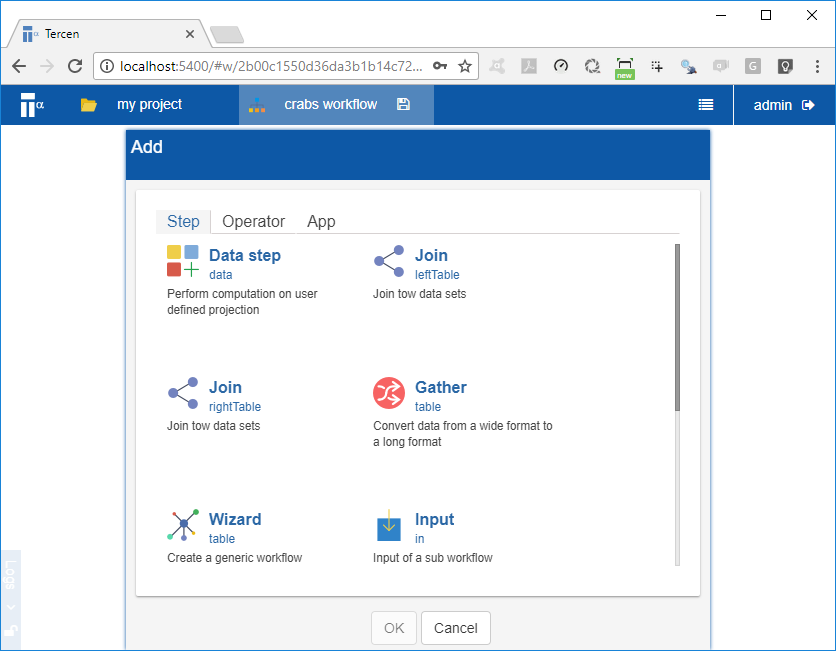
A projection page opens
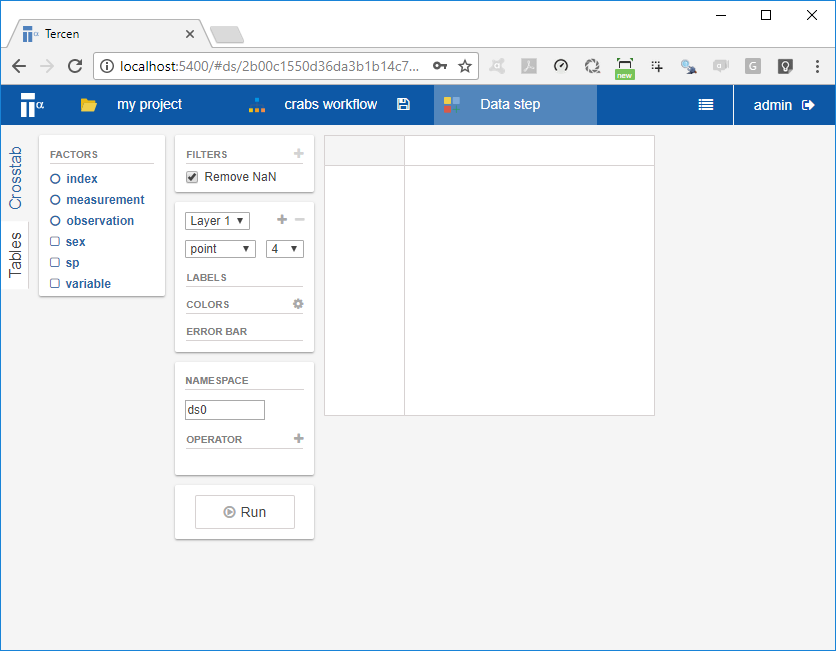
The projection page is composed of different zones. The main zones are indicated in red and the zones are highlighted by green, see image below:
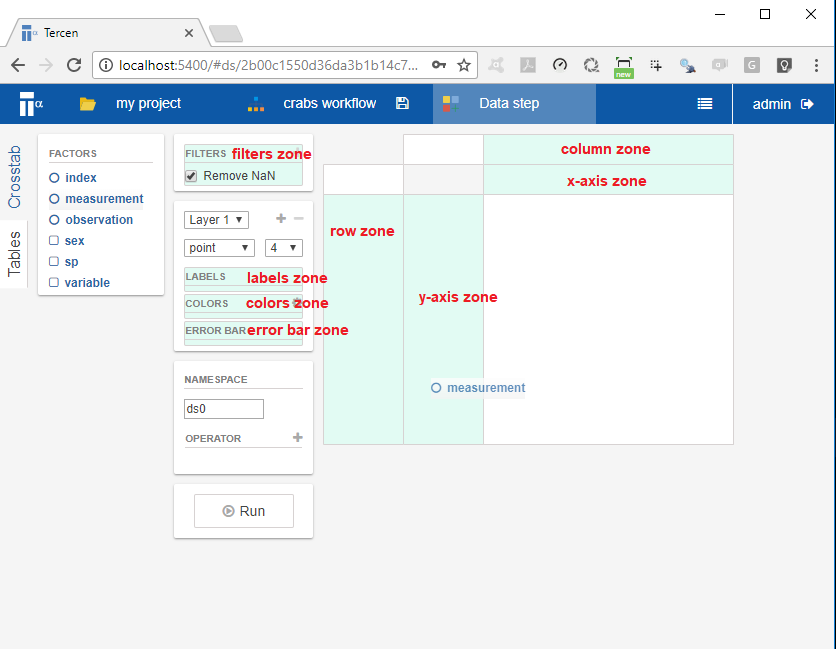
You can create any projection by dragging-n-dropping of items in the factors list to the different zones (indicated by the color green) of the projection page. There are four zones on the right and three on the left.
On the right are:
- y-axis zone
- x-axis zone
- column zone
- row zone
on the left are:
label zone
colors zone
error bar zone
Drag-n-drop the
measurementfactor to the y-axis zoneDrag-n-drop the
variablefactor to the row zoneDrag-n-drop the
observationfactor to the column zone
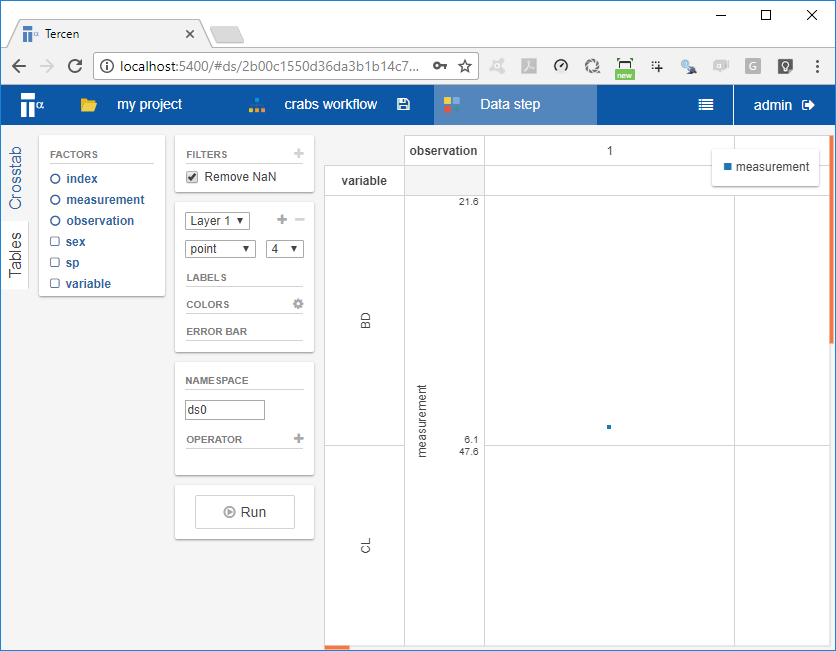
The image should look like the one above. Notice, the variable are the row and the observations are the columns.
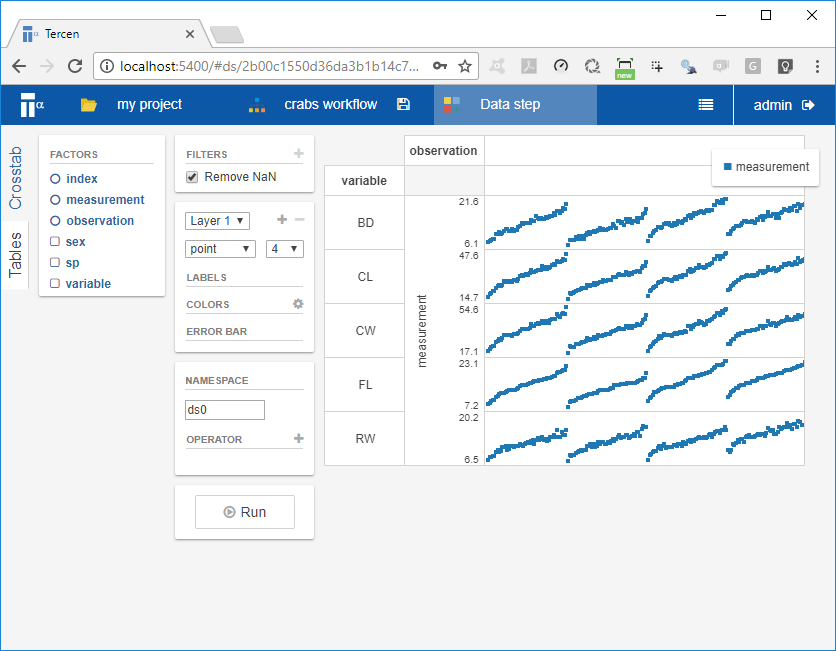
Resize the image by putting the mouse on the row lines and dragging them closer. Similarly for the columns. The image should look like:
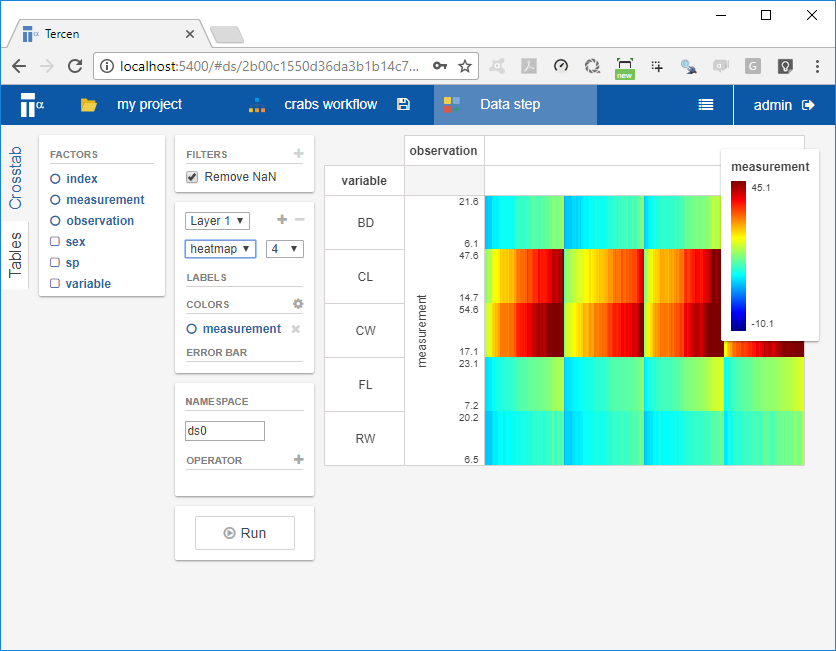
Drag-n-drop the
measurementto colors zoneSelect
heatmapin the drop down menu where it currently sayspoint
The projection window should now show the following:
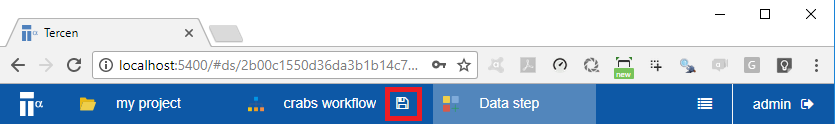
- Save your workflow by save icon beside the
crabs workflowpage