Chapter 15 Visualize a pairwise
In this section you create a multi-group pairwise visual. A powerful visual.
Click on the
crabs datastep and select AddChoose a Data step and click OK This will create a second data step and a new projection page opens.
![]()
We will now create a pairwise projection of the variable.
- Drag-n-drop the
measurementfactor to the y-axis zone - Drag-n-drop the
variablefactor to the column zone - Drag-n-drop the
variablefactor to the row zone - Drag-n-drop the
indexfactor to the label zone Resize the project view by using putting the mouse over the row lines dragging the rows tighter, similarly for the columns. Once resized the view should look like: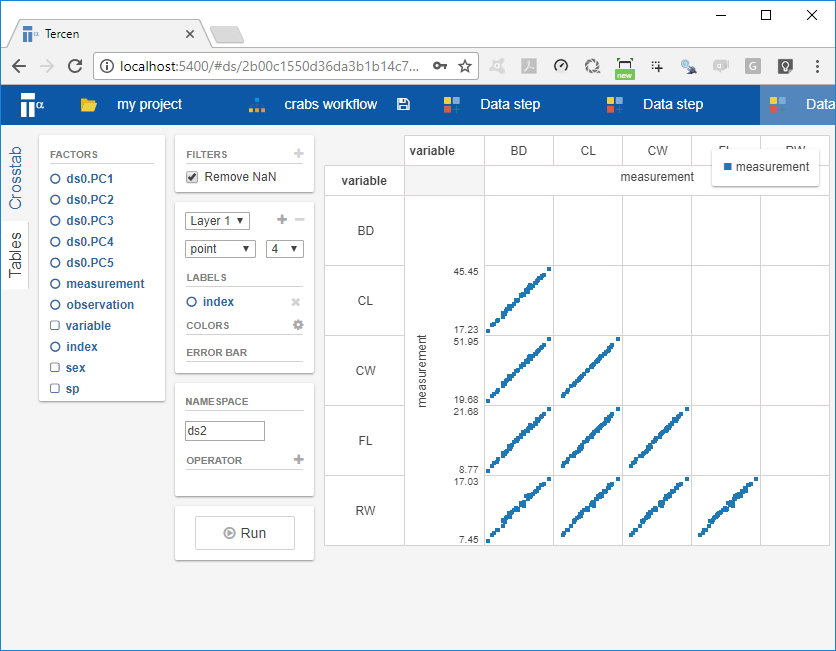
This is a pairwise projection and it is a direct result of putting the same factor (i.e. variable) on the row and column zone. However this projection can be further developed into multi-group pariwise.
- Drag-n-drop the
spfactor to the column zone - Drag-n-drop the
sexfactor to the color zone
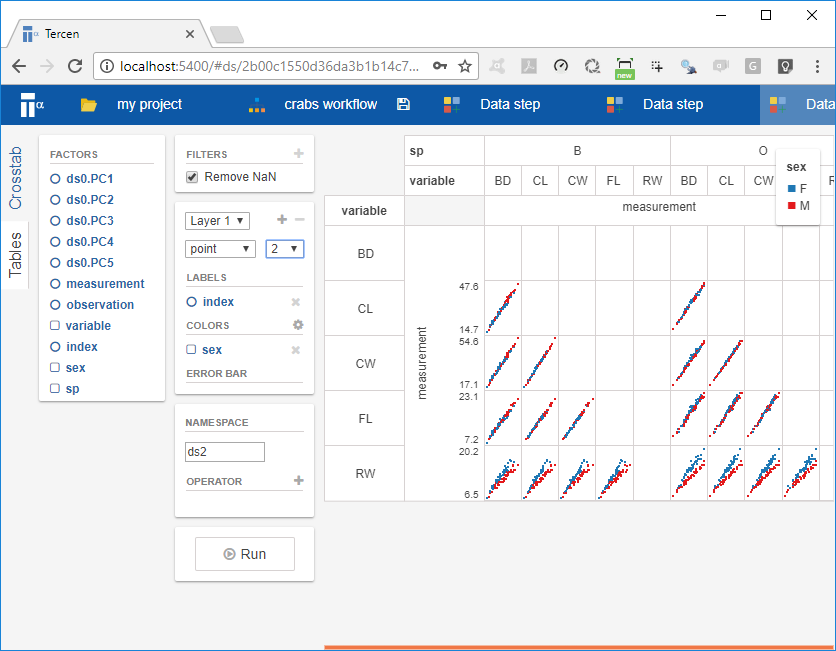
You have now completed the multi-group pairwise. This view is a powerful projection.
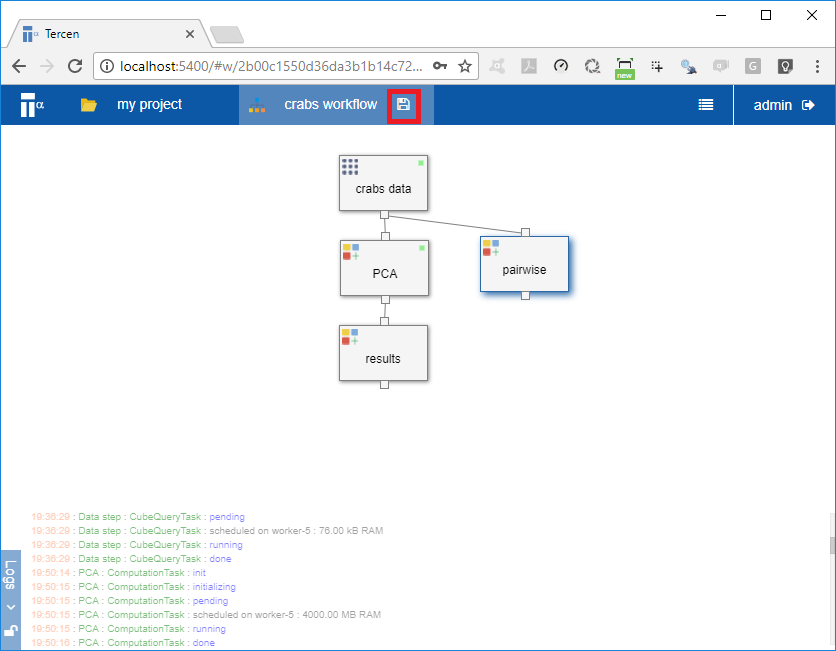
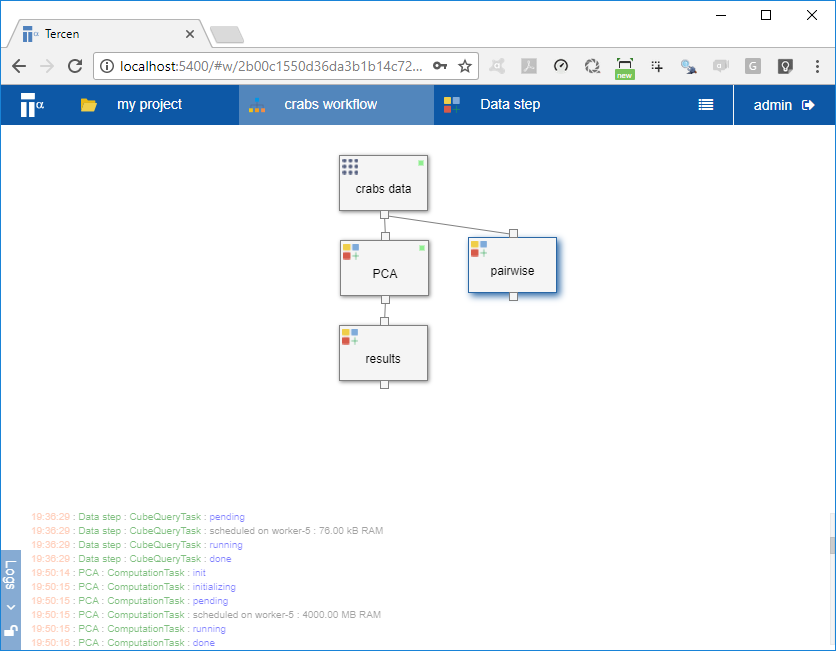
- Click on the crabs workflow page on the top bar
Your workflow should look like the following:
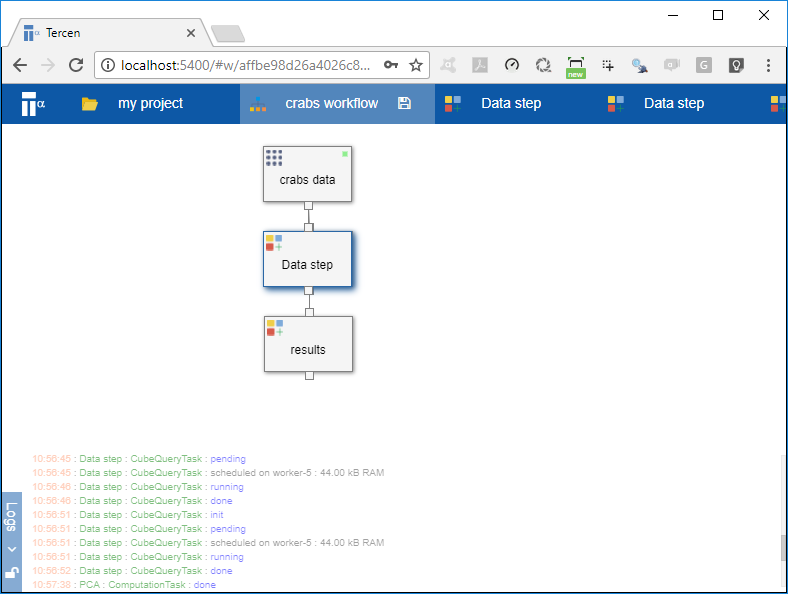
Note the new Data step you added previous got pasted ontop of previous step called PCA. We drag it to the side to show this.
- Drag the step called
Data stepto the right, it should now look like:

- Right click on the step called
Data stepand select Rename Rename it to “pairwise”
- In the top bar, close all pages except the crab workflow page.
- Click on the save icon beside the crab workflow page of the top bar