Chapter 14 Visualize the result
In this section you visualize the output of your previous PCA computation. The visual uses two principal components in a pair-wise plot.
Right click on the data step and select
AddChoose a
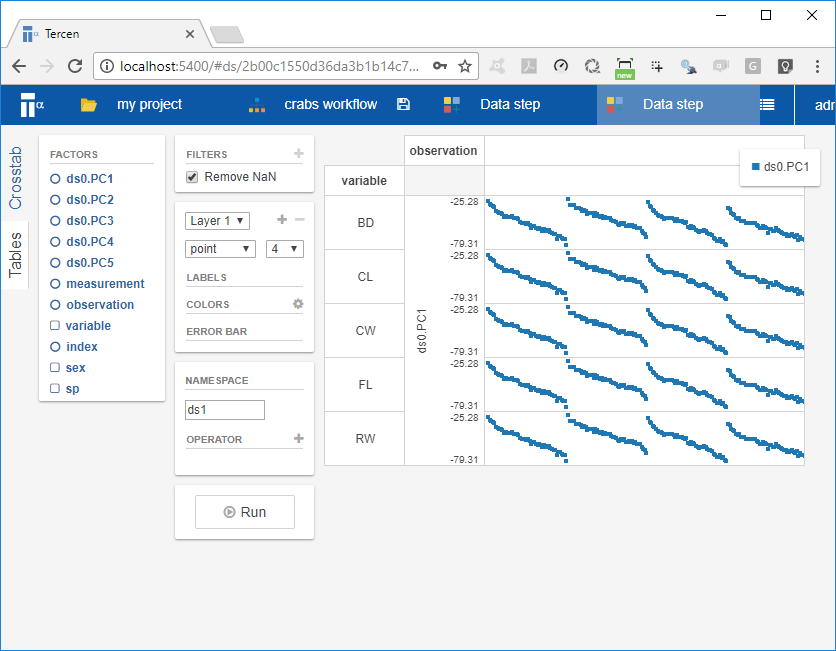
Data stepand clickOKA new projection page opens. This projection page should be familiar as you have seen this before in the previous steps of the this guide. However you will notice there are additional factors in the factor list, namely
ds0.PC1,ds0.PC2, etc..
First we require to empty the project by removing factors. Note a tiny x appears when the mouse is place over the factor to be removed (see red circle below).
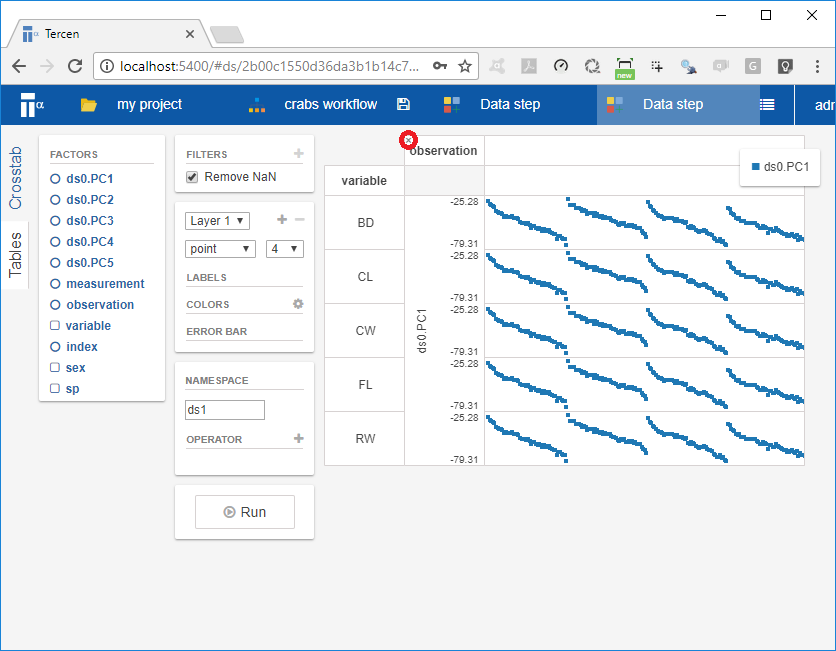
- Remove
observationfrom the column zone - Remove
variablefrom the row zone - Remove
ds0.PC1from the y-axis
The result view should be an empty projection
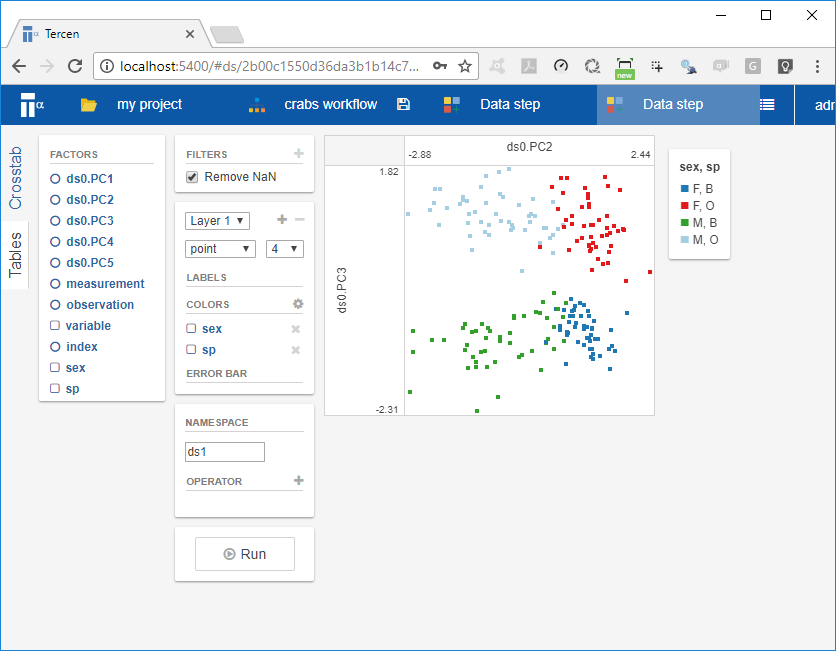
![]() Now you create the required project by
* Drag-n-drop the
Now you create the required project by
* Drag-n-drop the ds0.PC2 factor to the x-axis zone
* Drag-n-drop the ds0.PC3 factor to the y-axis zone
* Drag-n-drop the sex and species factor to the colors zone
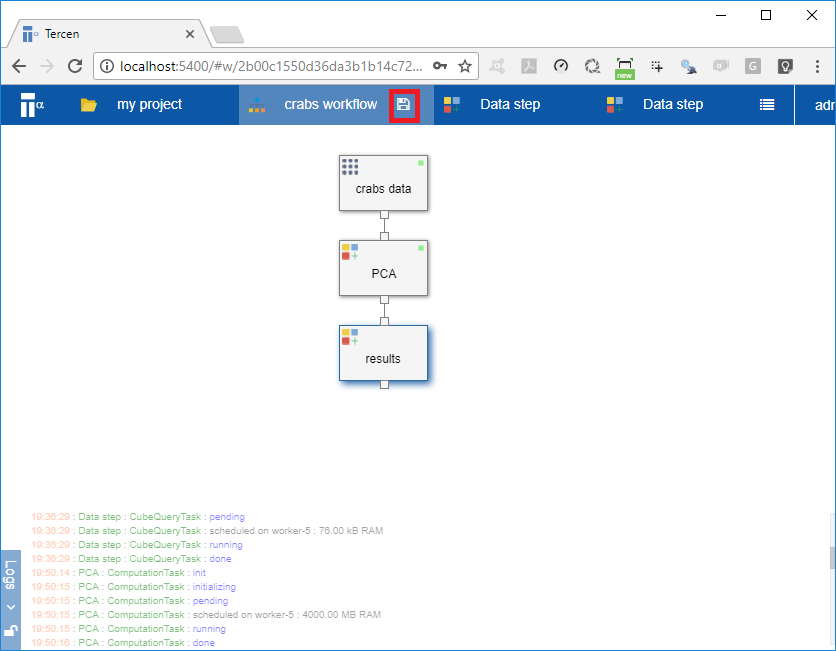
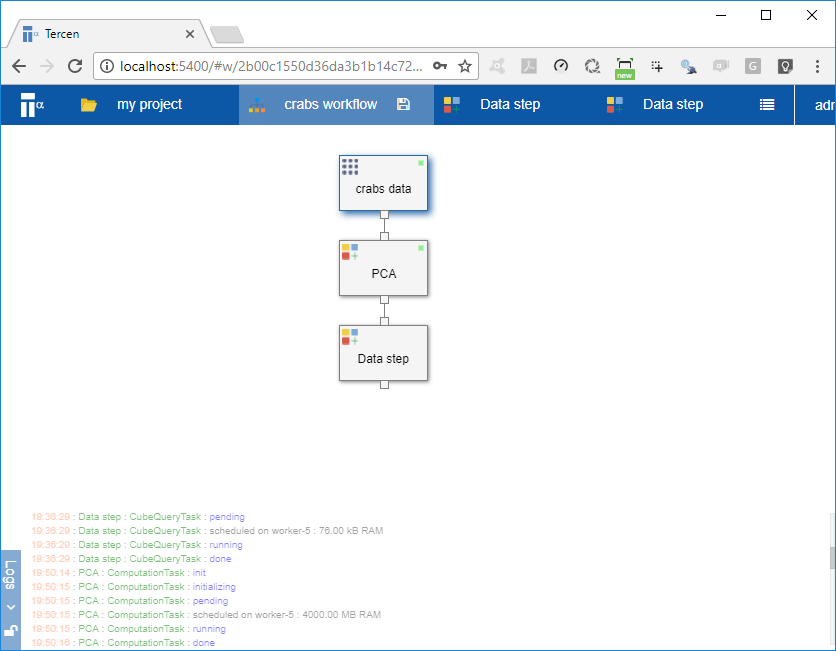
Click on the crabs workflow page on the top bar, the presented workflow is:
Right click on the Data step and select
RenameRename it to “results”

- Save workflow by clicking on the save icon in the tope bar beside the
crabs workflow