Chapter 12 Visualize gathered PCA results
In this section you create a pairwise visual of the Principal Components collected in the Gather step.
All Principal Components will be plotted against each other in a multi-pairwise visualization.
Add a new data step
From the workflow builder screen.
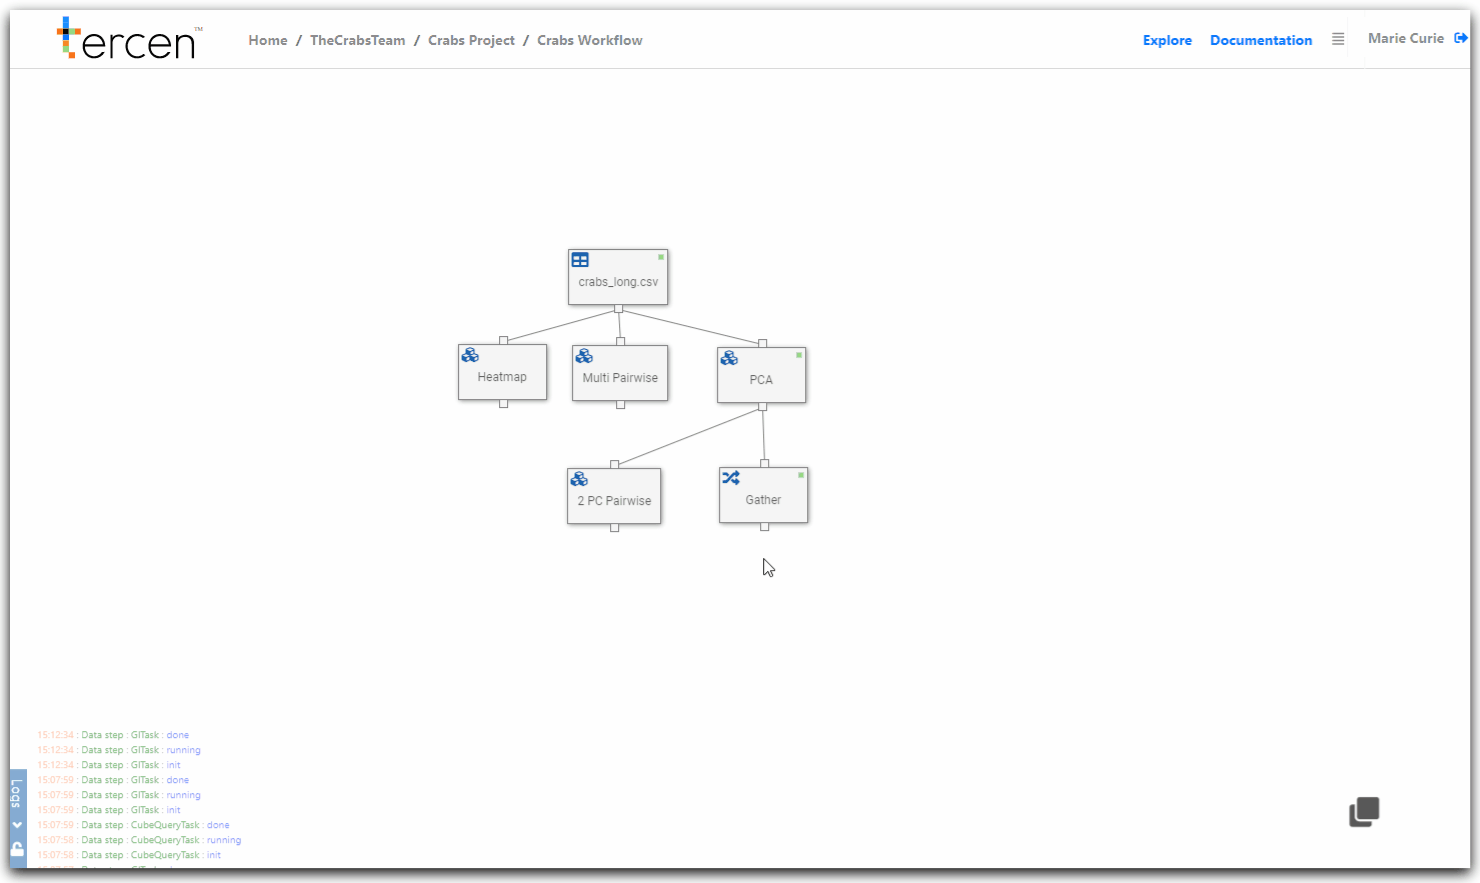
Right Click on the Gather data step
Select Add
Choose Data step
This will create a new child step.
Clear the projection grid by clicking X
Create a pairwise projection of the gathered Principle Components
Drag and drop the following factors to the projection grid zones.
PCA.value to y-axis
PCA.variable to column
PCA.variable to row
observation to labels
Color to Colors
sex to Colors
Putting two factors on Color combines them to indicate the crab specimens by their groups. (Orange Male, Blue Female etc).
Placing Observation on Label separates the data points into individual crabs so they can be plotted.
Re-size the grid lines to make the projection view-able
Save the workflow
Rename the new Data step to “Multi PC Pairwise”
You have created a pairwise projection of all the Principal Components.
Next… create an export step for the PCS results.