Chapter 10 Visualize the results of the PCA
Computations made in a data step can become inputs to data steps that are below them in the workflow.
In Tercen both the original data, and the computation results, are passed to the “child” step.
In this Chapter we will visualize the output of the PCA computation.
We will use two of the results (Principal Components) in a pair-wise plot.
Add a new data step
From the workflow builder screen.
Right Click on the PCA data step to access the long menu
Select Add
Choose Data Step
The projection screen will open.
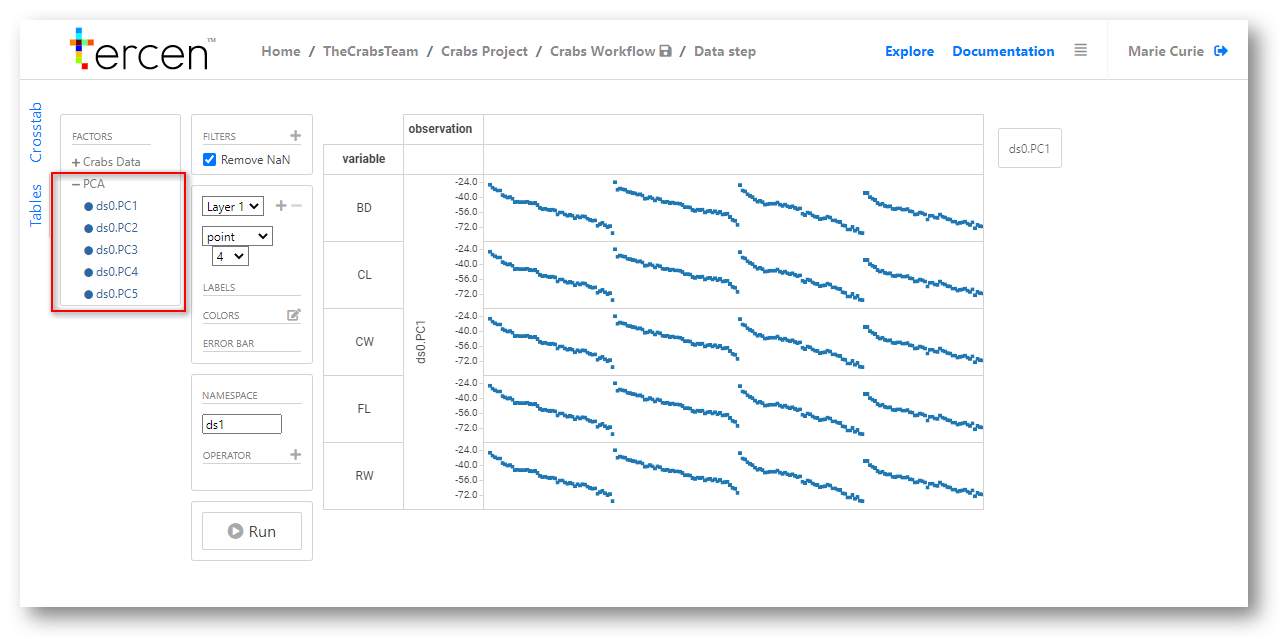
You will see it is a copy of the “parent” data step PCA with a new set of factors
The new factors are the results of the previous PCA computation step.
The results (Principle Components) are labeled PC1 to PC5.
PCs are a number of uncorrelated variables, a score, used to identify clusters of data.
Click the + icon to view the new list of factors.
Use PCA results in a new visualisation
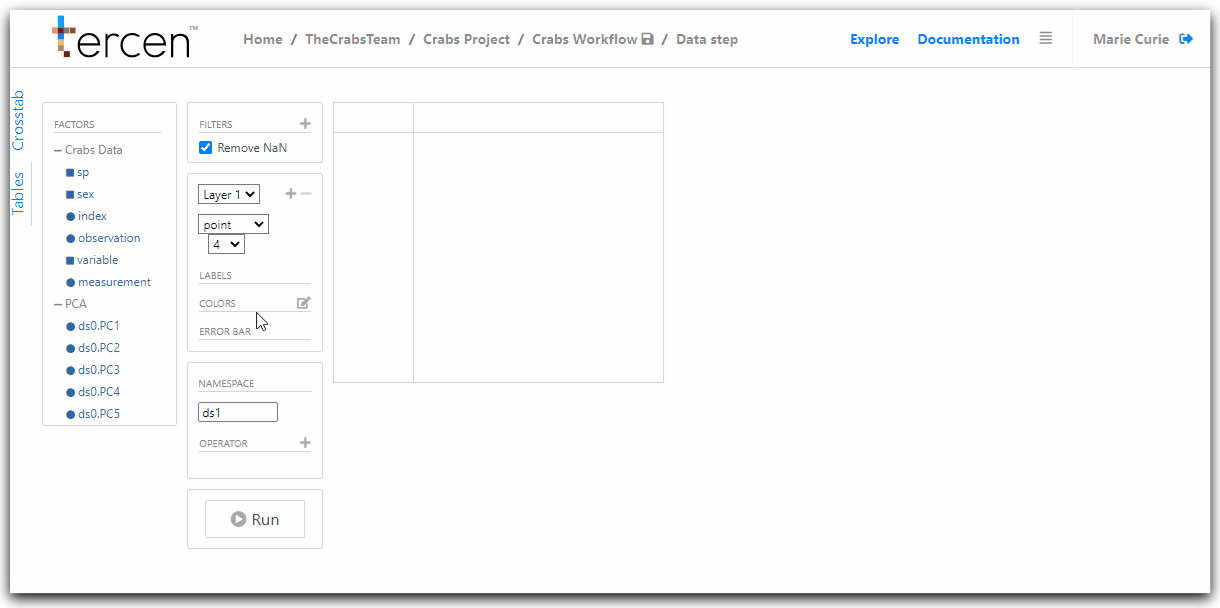
To create a new visualisation we must first remove the previous one.
Click the small X which appears in the corners of the projection grid divisions.
The resulting view should be an empty projection
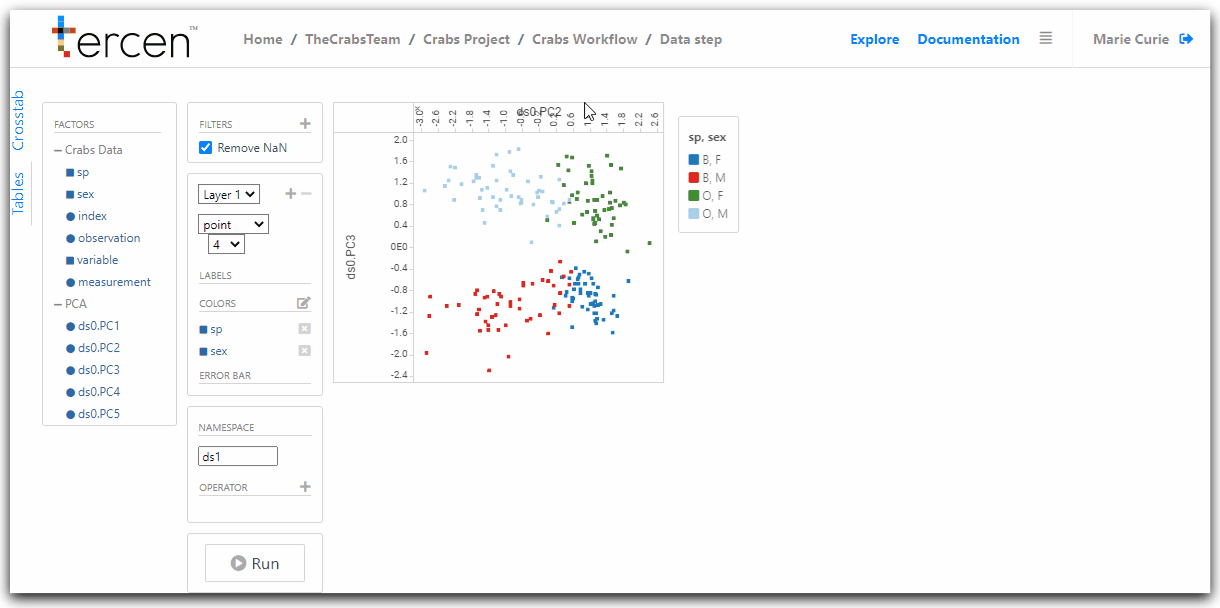
To create the a new pair-wise projection drag and drop the following factors:
PCA ds0.PC2 to X-Axis
PCA ds0.PC3 to Y-Axis
Crabs Data sex to Colors
Crabs Data sp to Colors
Save the workflow.
This creates a visualisation of the PCA results (PC2 and PC3) in a pairwise plot.
It is color coded to show the main sex/species groupings.
Return to the workflow builder screen to rename your data step.
Next… gather the PCA results to use them in a multi-group pairwise projection.